Hungarian vs Immigrants from Ghana In Labor Force | Age 35-44
COMPARE
Hungarian
Immigrants from Ghana
In Labor Force | Age 35-44
In Labor Force | Age 35-44 Comparison
Hungarians
Immigrants from Ghana
84.2%
IN LABOR FORCE | AGE 35-44
26.8/ 100
METRIC RATING
193rd/ 347
METRIC RANK
84.7%
IN LABOR FORCE | AGE 35-44
90.4/ 100
METRIC RATING
128th/ 347
METRIC RANK
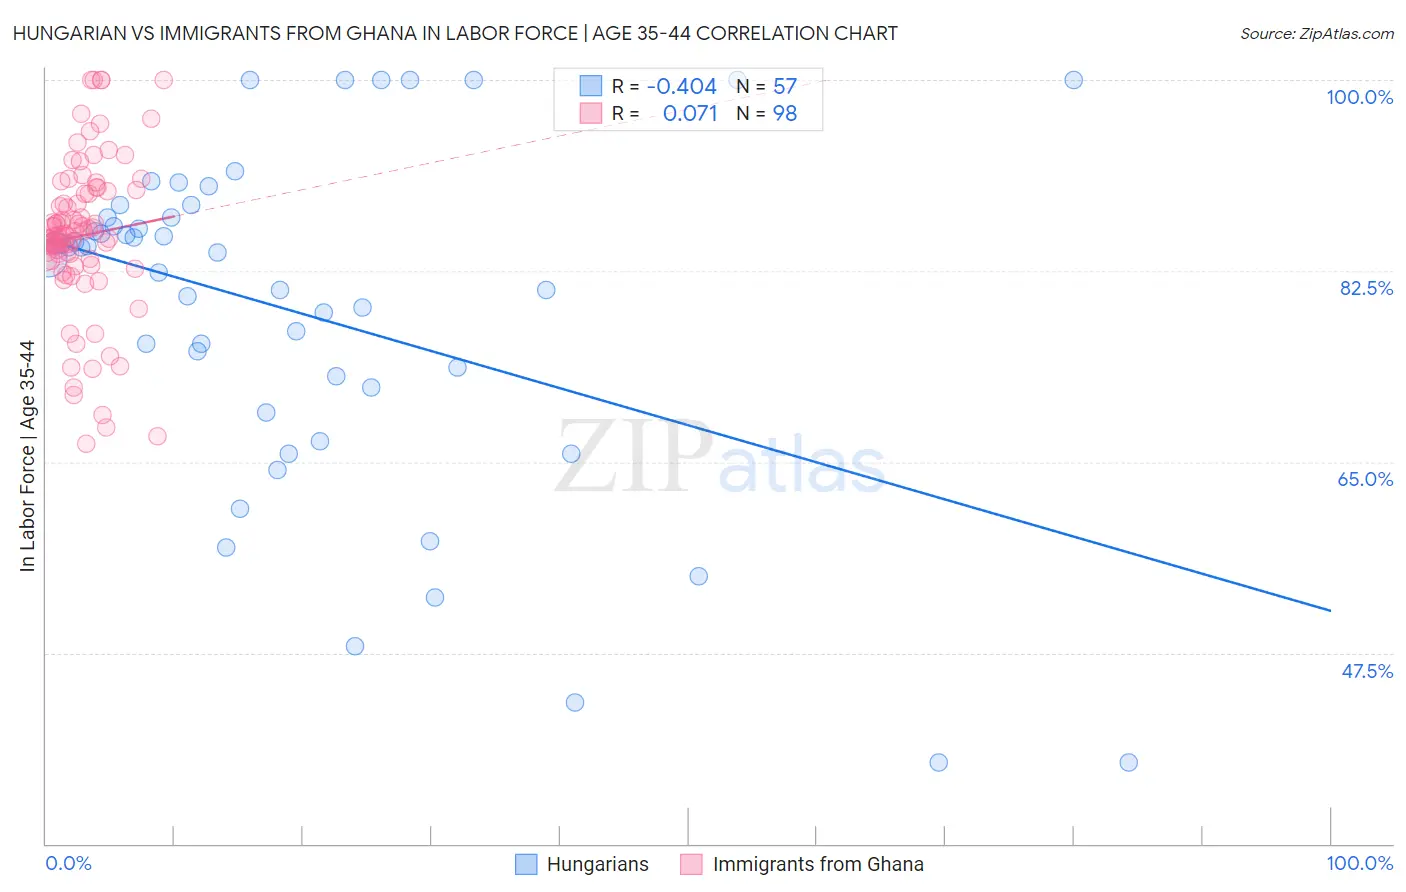
Hungarian vs Immigrants from Ghana In Labor Force | Age 35-44 Correlation Chart
The statistical analysis conducted on geographies consisting of 485,922,886 people shows a moderate negative correlation between the proportion of Hungarians and labor force participation rate among population between the ages 35 and 44 in the United States with a correlation coefficient (R) of -0.404 and weighted average of 84.2%. Similarly, the statistical analysis conducted on geographies consisting of 199,842,455 people shows a slight positive correlation between the proportion of Immigrants from Ghana and labor force participation rate among population between the ages 35 and 44 in the United States with a correlation coefficient (R) of 0.071 and weighted average of 84.7%, a difference of 0.53%.
In Labor Force | Age 35-44 Correlation Summary
| Measurement | Hungarian | Immigrants from Ghana |
| Minimum | 37.5% | 66.7% |
| Maximum | 100.0% | 100.0% |
| Range | 62.5% | 33.3% |
| Mean | 78.6% | 85.7% |
| Median | 84.2% | 85.8% |
| Interquartile 25% (IQ1) | 70.7% | 83.6% |
| Interquartile 75% (IQ3) | 87.4% | 89.6% |
| Interquartile Range (IQR) | 16.7% | 6.0% |
| Standard Deviation (Sample) | 15.7% | 7.0% |
| Standard Deviation (Population) | 15.6% | 7.0% |
Similar Demographics by In Labor Force | Age 35-44
Demographics Similar to Hungarians by In Labor Force | Age 35-44
In terms of in labor force | age 35-44, the demographic groups most similar to Hungarians are Immigrants from Philippines (84.2%, a difference of 0.010%), Immigrants from Vietnam (84.2%, a difference of 0.010%), Immigrants from Indonesia (84.2%, a difference of 0.010%), Immigrants from Caribbean (84.2%, a difference of 0.010%), and Immigrants from England (84.2%, a difference of 0.010%).
| Demographics | Rating | Rank | In Labor Force | Age 35-44 |
| Australians | 35.1 /100 | #186 | Fair 84.3% |
| Dutch | 34.8 /100 | #187 | Fair 84.3% |
| South Africans | 34.1 /100 | #188 | Fair 84.3% |
| Immigrants | Denmark | 33.7 /100 | #189 | Fair 84.3% |
| Portuguese | 31.9 /100 | #190 | Fair 84.3% |
| Immigrants | Philippines | 27.9 /100 | #191 | Fair 84.2% |
| Immigrants | Vietnam | 27.4 /100 | #192 | Fair 84.2% |
| Hungarians | 26.8 /100 | #193 | Fair 84.2% |
| Immigrants | Indonesia | 25.7 /100 | #194 | Fair 84.2% |
| Immigrants | Caribbean | 25.7 /100 | #195 | Fair 84.2% |
| Immigrants | England | 25.0 /100 | #196 | Fair 84.2% |
| Immigrants | Western Europe | 24.7 /100 | #197 | Fair 84.2% |
| Ecuadorians | 24.0 /100 | #198 | Fair 84.2% |
| Syrians | 23.2 /100 | #199 | Fair 84.2% |
| Moroccans | 23.2 /100 | #200 | Fair 84.2% |
Demographics Similar to Immigrants from Ghana by In Labor Force | Age 35-44
In terms of in labor force | age 35-44, the demographic groups most similar to Immigrants from Ghana are Asian (84.7%, a difference of 0.0%), Immigrants from Spain (84.7%, a difference of 0.0%), German (84.7%, a difference of 0.010%), Immigrants from South America (84.7%, a difference of 0.010%), and Slavic (84.7%, a difference of 0.010%).
| Demographics | Rating | Rank | In Labor Force | Age 35-44 |
| Finns | 91.2 /100 | #121 | Exceptional 84.7% |
| Germans | 91.0 /100 | #122 | Exceptional 84.7% |
| Immigrants | South America | 90.9 /100 | #123 | Exceptional 84.7% |
| Slavs | 90.8 /100 | #124 | Exceptional 84.7% |
| Maltese | 90.8 /100 | #125 | Exceptional 84.7% |
| Asians | 90.6 /100 | #126 | Exceptional 84.7% |
| Immigrants | Spain | 90.6 /100 | #127 | Exceptional 84.7% |
| Immigrants | Ghana | 90.4 /100 | #128 | Exceptional 84.7% |
| Palestinians | 89.7 /100 | #129 | Excellent 84.7% |
| Bhutanese | 89.7 /100 | #130 | Excellent 84.7% |
| Immigrants | Scotland | 89.6 /100 | #131 | Excellent 84.7% |
| Austrians | 89.4 /100 | #132 | Excellent 84.7% |
| Argentineans | 88.4 /100 | #133 | Excellent 84.6% |
| Immigrants | Korea | 88.2 /100 | #134 | Excellent 84.6% |
| Immigrants | Malaysia | 87.5 /100 | #135 | Excellent 84.6% |