Hungarian vs Immigrants from Croatia Hearing Disability
COMPARE
Hungarian
Immigrants from Croatia
Hearing Disability
Hearing Disability Comparison
Hungarians
Immigrants from Croatia
3.4%
HEARING DISABILITY
0.4/ 100
METRIC RATING
251st/ 347
METRIC RANK
3.1%
HEARING DISABILITY
20.5/ 100
METRIC RATING
198th/ 347
METRIC RANK
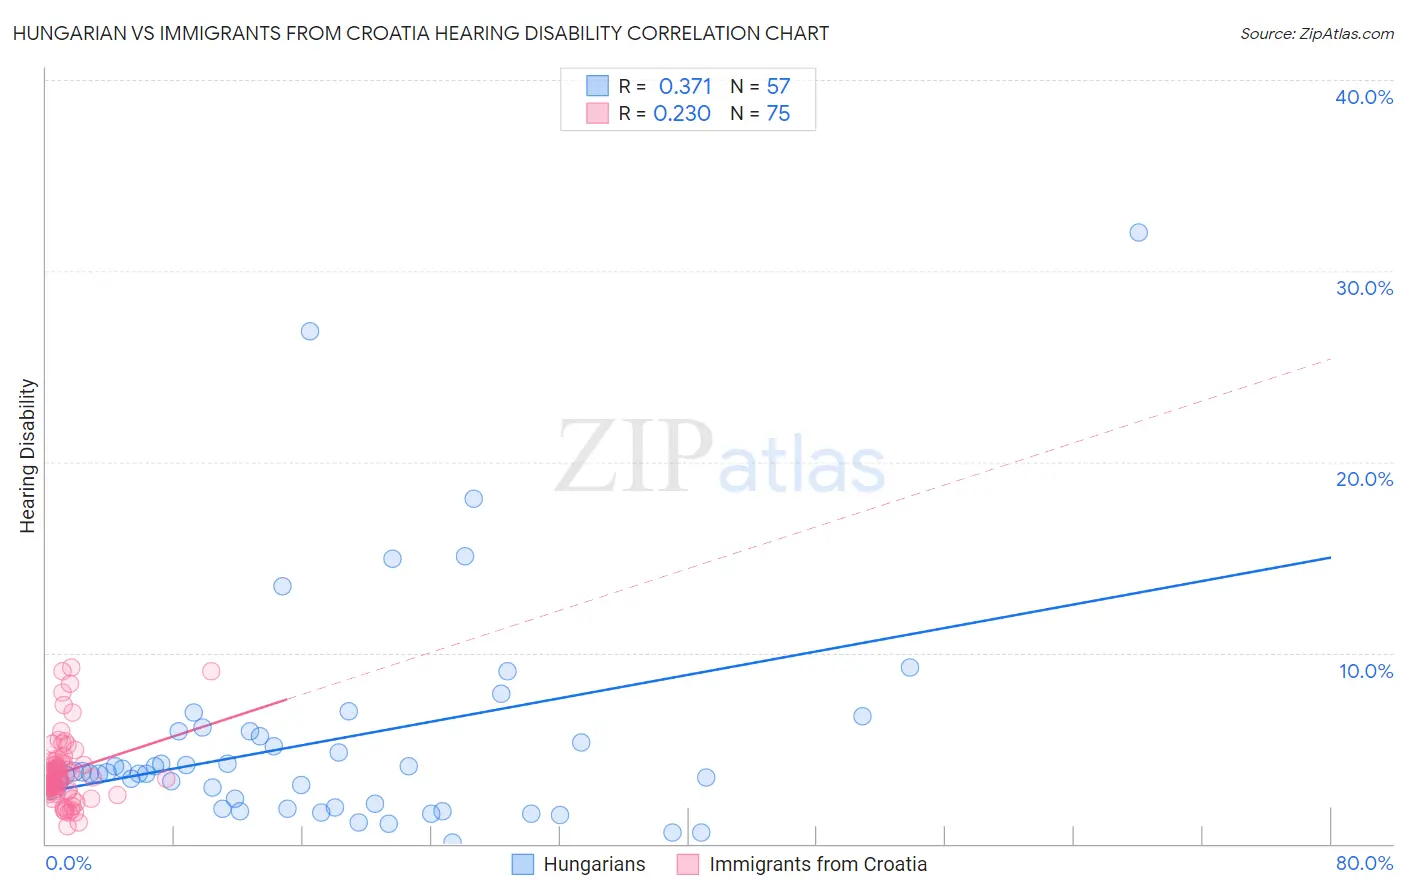
Hungarian vs Immigrants from Croatia Hearing Disability Correlation Chart
The statistical analysis conducted on geographies consisting of 485,961,272 people shows a mild positive correlation between the proportion of Hungarians and percentage of population with hearing disability in the United States with a correlation coefficient (R) of 0.371 and weighted average of 3.4%. Similarly, the statistical analysis conducted on geographies consisting of 132,571,835 people shows a weak positive correlation between the proportion of Immigrants from Croatia and percentage of population with hearing disability in the United States with a correlation coefficient (R) of 0.230 and weighted average of 3.1%, a difference of 9.5%.
Hearing Disability Correlation Summary
| Measurement | Hungarian | Immigrants from Croatia |
| Minimum | 0.091% | 0.95% |
| Maximum | 32.0% | 9.2% |
| Range | 31.9% | 8.3% |
| Mean | 5.4% | 3.8% |
| Median | 3.7% | 3.4% |
| Interquartile 25% (IQ1) | 2.0% | 2.8% |
| Interquartile 75% (IQ3) | 5.9% | 4.2% |
| Interquartile Range (IQR) | 3.9% | 1.5% |
| Standard Deviation (Sample) | 5.9% | 1.8% |
| Standard Deviation (Population) | 5.8% | 1.8% |
Similar Demographics by Hearing Disability
Demographics Similar to Hungarians by Hearing Disability
In terms of hearing disability, the demographic groups most similar to Hungarians are Croatian (3.4%, a difference of 0.21%), Yuman (3.4%, a difference of 0.23%), Italian (3.4%, a difference of 0.24%), Carpatho Rusyn (3.4%, a difference of 0.66%), and Austrian (3.4%, a difference of 0.77%).
| Demographics | Rating | Rank | Hearing Disability |
| Assyrians/Chaldeans/Syriacs | 0.9 /100 | #244 | Tragic 3.3% |
| Immigrants | Scotland | 0.8 /100 | #245 | Tragic 3.3% |
| Immigrants | England | 0.7 /100 | #246 | Tragic 3.3% |
| Lithuanians | 0.6 /100 | #247 | Tragic 3.4% |
| Austrians | 0.6 /100 | #248 | Tragic 3.4% |
| Italians | 0.4 /100 | #249 | Tragic 3.4% |
| Yuman | 0.4 /100 | #250 | Tragic 3.4% |
| Hungarians | 0.4 /100 | #251 | Tragic 3.4% |
| Croatians | 0.4 /100 | #252 | Tragic 3.4% |
| Carpatho Rusyns | 0.3 /100 | #253 | Tragic 3.4% |
| Slavs | 0.2 /100 | #254 | Tragic 3.4% |
| Poles | 0.2 /100 | #255 | Tragic 3.4% |
| Hmong | 0.2 /100 | #256 | Tragic 3.4% |
| Yaqui | 0.2 /100 | #257 | Tragic 3.4% |
| Northern Europeans | 0.2 /100 | #258 | Tragic 3.4% |
Demographics Similar to Immigrants from Croatia by Hearing Disability
In terms of hearing disability, the demographic groups most similar to Immigrants from Croatia are Immigrants from Bosnia and Herzegovina (3.1%, a difference of 0.020%), Syrian (3.1%, a difference of 0.18%), Immigrants from North Macedonia (3.1%, a difference of 0.19%), Iraqi (3.1%, a difference of 0.22%), and Immigrants from Europe (3.1%, a difference of 0.32%).
| Demographics | Rating | Rank | Hearing Disability |
| Immigrants | Switzerland | 28.8 /100 | #191 | Fair 3.1% |
| Koreans | 27.6 /100 | #192 | Fair 3.1% |
| Macedonians | 27.0 /100 | #193 | Fair 3.1% |
| South Africans | 24.5 /100 | #194 | Fair 3.1% |
| Spanish American Indians | 24.1 /100 | #195 | Fair 3.1% |
| Immigrants | Europe | 22.9 /100 | #196 | Fair 3.1% |
| Immigrants | Bosnia and Herzegovina | 20.6 /100 | #197 | Fair 3.1% |
| Immigrants | Croatia | 20.5 /100 | #198 | Fair 3.1% |
| Syrians | 19.2 /100 | #199 | Poor 3.1% |
| Immigrants | North Macedonia | 19.1 /100 | #200 | Poor 3.1% |
| Iraqis | 19.0 /100 | #201 | Poor 3.1% |
| Immigrants | Thailand | 16.4 /100 | #202 | Poor 3.1% |
| Immigrants | Denmark | 16.2 /100 | #203 | Poor 3.1% |
| Immigrants | Czechoslovakia | 15.9 /100 | #204 | Poor 3.1% |
| Alsatians | 15.9 /100 | #205 | Poor 3.1% |