Hopi vs Immigrants from Uganda 4 or more Vehicles in Household
COMPARE
Hopi
Immigrants from Uganda
4 or more Vehicles in Household
4 or more Vehicles in Household Comparison
Hopi
Immigrants from Uganda
6.9%
4 OR MORE VEHICLES IN HOUSEHOLD
97.0/ 100
METRIC RATING
112th/ 347
METRIC RANK
5.9%
4 OR MORE VEHICLES IN HOUSEHOLD
7.5/ 100
METRIC RATING
228th/ 347
METRIC RANK
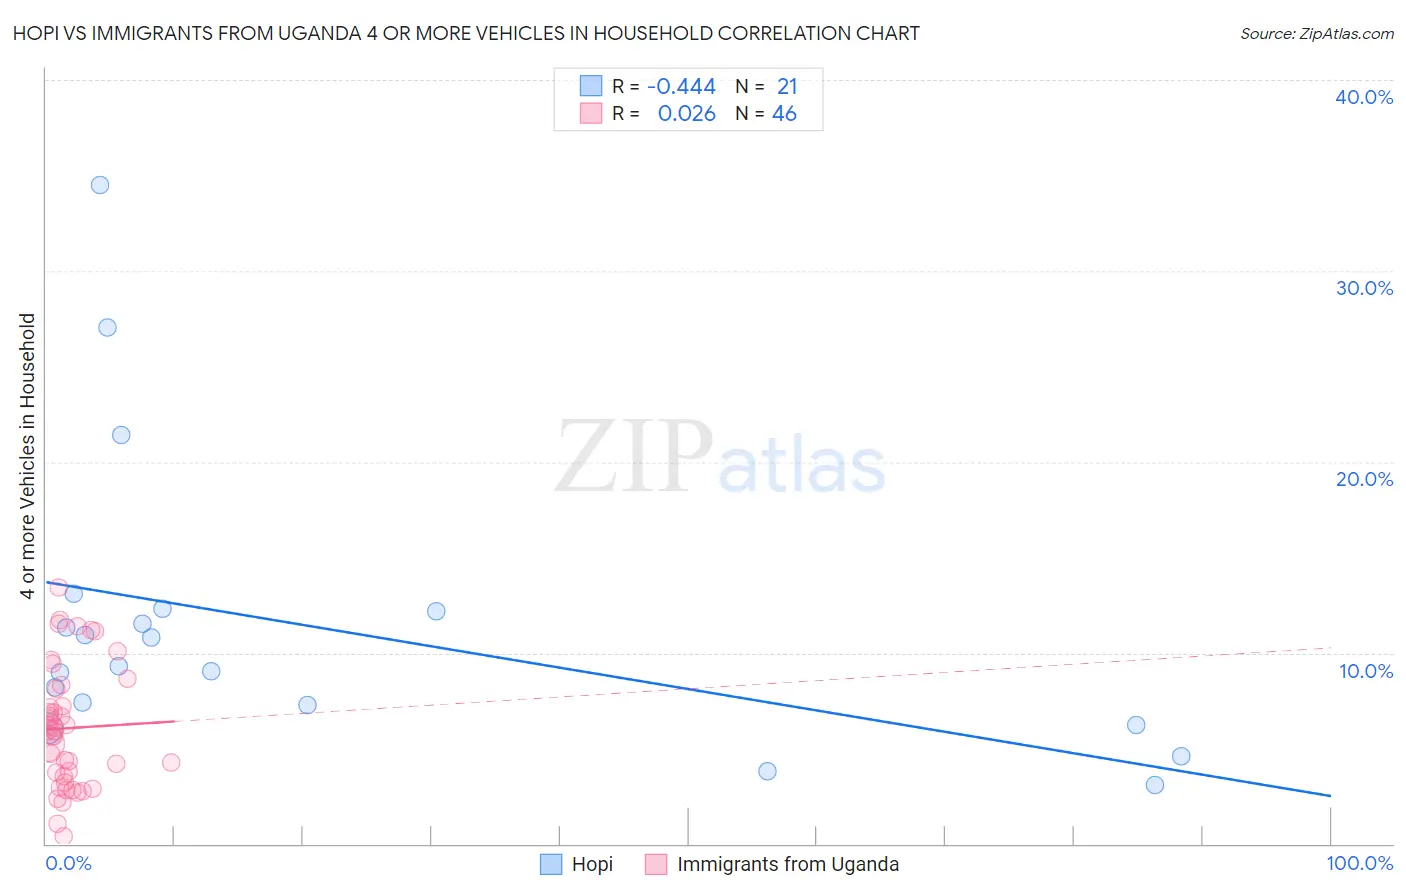
Hopi vs Immigrants from Uganda 4 or more Vehicles in Household Correlation Chart
The statistical analysis conducted on geographies consisting of 74,704,966 people shows a moderate negative correlation between the proportion of Hopi and percentage of households with 4 or more vehicles available in the United States with a correlation coefficient (R) of -0.444 and weighted average of 6.9%. Similarly, the statistical analysis conducted on geographies consisting of 125,864,473 people shows no correlation between the proportion of Immigrants from Uganda and percentage of households with 4 or more vehicles available in the United States with a correlation coefficient (R) of 0.026 and weighted average of 5.9%, a difference of 16.1%.
4 or more Vehicles in Household Correlation Summary
| Measurement | Hopi | Immigrants from Uganda |
| Minimum | 3.0% | 0.38% |
| Maximum | 34.5% | 13.5% |
| Range | 31.5% | 13.1% |
| Mean | 11.4% | 6.1% |
| Median | 9.3% | 5.9% |
| Interquartile 25% (IQ1) | 6.8% | 3.5% |
| Interquartile 75% (IQ3) | 12.2% | 8.1% |
| Interquartile Range (IQR) | 5.5% | 4.6% |
| Standard Deviation (Sample) | 7.7% | 3.2% |
| Standard Deviation (Population) | 7.5% | 3.1% |
Similar Demographics by 4 or more Vehicles in Household
Demographics Similar to Hopi by 4 or more Vehicles in Household
In terms of 4 or more vehicles in household, the demographic groups most similar to Hopi are Aleut (6.9%, a difference of 0.010%), Immigrants from Thailand (6.9%, a difference of 0.030%), Canadian (6.9%, a difference of 0.42%), Bolivian (6.8%, a difference of 0.47%), and Tlingit-Haida (6.8%, a difference of 0.53%).
| Demographics | Rating | Rank | 4 or more Vehicles in Household |
| German Russians | 98.3 /100 | #105 | Exceptional 7.0% |
| Guatemalans | 98.1 /100 | #106 | Exceptional 7.0% |
| Nicaraguans | 98.0 /100 | #107 | Exceptional 7.0% |
| French | 97.7 /100 | #108 | Exceptional 6.9% |
| Filipinos | 97.6 /100 | #109 | Exceptional 6.9% |
| Immigrants | Thailand | 97.0 /100 | #110 | Exceptional 6.9% |
| Aleuts | 97.0 /100 | #111 | Exceptional 6.9% |
| Hopi | 97.0 /100 | #112 | Exceptional 6.9% |
| Canadians | 96.4 /100 | #113 | Exceptional 6.9% |
| Bolivians | 96.3 /100 | #114 | Exceptional 6.8% |
| Tlingit-Haida | 96.2 /100 | #115 | Exceptional 6.8% |
| Immigrants | Guatemala | 95.8 /100 | #116 | Exceptional 6.8% |
| Burmese | 95.7 /100 | #117 | Exceptional 6.8% |
| French American Indians | 95.7 /100 | #118 | Exceptional 6.8% |
| Costa Ricans | 95.5 /100 | #119 | Exceptional 6.8% |
Demographics Similar to Immigrants from Uganda by 4 or more Vehicles in Household
In terms of 4 or more vehicles in household, the demographic groups most similar to Immigrants from Uganda are Immigrants from Western Asia (5.9%, a difference of 0.090%), Immigrants from Singapore (5.9%, a difference of 0.13%), Eastern European (5.9%, a difference of 0.28%), Immigrants from Malaysia (5.9%, a difference of 0.35%), and Immigrants from Switzerland (5.9%, a difference of 0.47%).
| Demographics | Rating | Rank | 4 or more Vehicles in Household |
| Immigrants | Moldova | 9.3 /100 | #221 | Tragic 6.0% |
| Cajuns | 9.2 /100 | #222 | Tragic 6.0% |
| Immigrants | Kenya | 9.2 /100 | #223 | Tragic 6.0% |
| Cubans | 9.2 /100 | #224 | Tragic 6.0% |
| Indonesians | 8.9 /100 | #225 | Tragic 6.0% |
| Immigrants | Singapore | 7.9 /100 | #226 | Tragic 5.9% |
| Immigrants | Western Asia | 7.8 /100 | #227 | Tragic 5.9% |
| Immigrants | Uganda | 7.5 /100 | #228 | Tragic 5.9% |
| Eastern Europeans | 6.8 /100 | #229 | Tragic 5.9% |
| Immigrants | Malaysia | 6.7 /100 | #230 | Tragic 5.9% |
| Immigrants | Switzerland | 6.4 /100 | #231 | Tragic 5.9% |
| Immigrants | Argentina | 6.0 /100 | #232 | Tragic 5.9% |
| Sierra Leoneans | 6.0 /100 | #233 | Tragic 5.9% |
| Africans | 4.6 /100 | #234 | Tragic 5.8% |
| Immigrants | Hungary | 4.6 /100 | #235 | Tragic 5.8% |