Bulgarian vs Immigrants from Uganda 4 or more Vehicles in Household
COMPARE
Bulgarian
Immigrants from Uganda
4 or more Vehicles in Household
4 or more Vehicles in Household Comparison
Bulgarians
Immigrants from Uganda
5.8%
4 OR MORE VEHICLES IN HOUSEHOLD
3.1/ 100
METRIC RATING
245th/ 347
METRIC RANK
5.9%
4 OR MORE VEHICLES IN HOUSEHOLD
7.5/ 100
METRIC RATING
228th/ 347
METRIC RANK
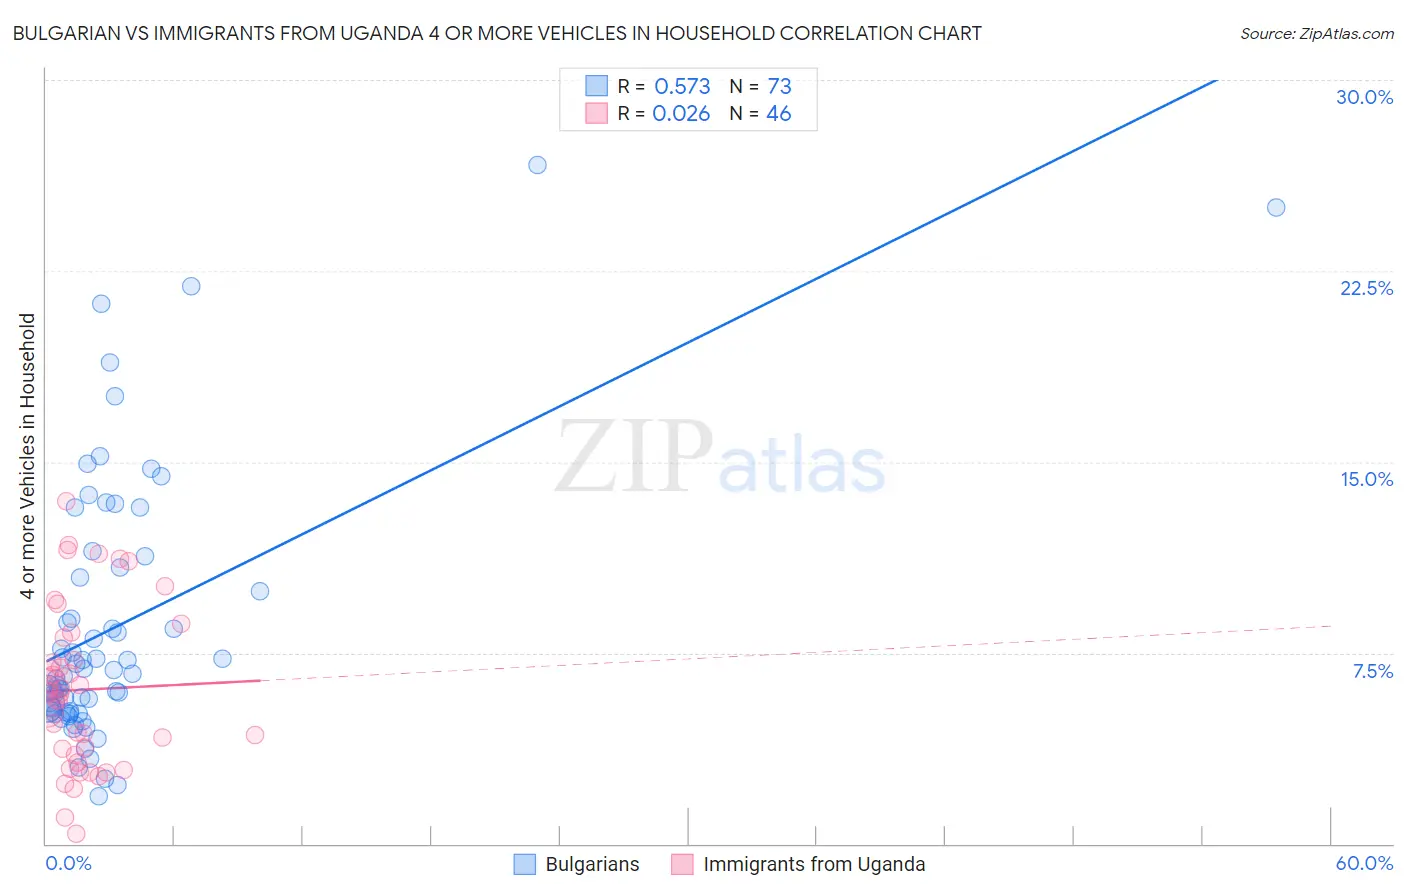
Bulgarian vs Immigrants from Uganda 4 or more Vehicles in Household Correlation Chart
The statistical analysis conducted on geographies consisting of 205,001,744 people shows a substantial positive correlation between the proportion of Bulgarians and percentage of households with 4 or more vehicles available in the United States with a correlation coefficient (R) of 0.573 and weighted average of 5.8%. Similarly, the statistical analysis conducted on geographies consisting of 125,864,473 people shows no correlation between the proportion of Immigrants from Uganda and percentage of households with 4 or more vehicles available in the United States with a correlation coefficient (R) of 0.026 and weighted average of 5.9%, a difference of 2.6%.
4 or more Vehicles in Household Correlation Summary
| Measurement | Bulgarian | Immigrants from Uganda |
| Minimum | 1.9% | 0.38% |
| Maximum | 26.7% | 13.5% |
| Range | 24.8% | 13.1% |
| Mean | 8.5% | 6.1% |
| Median | 6.7% | 5.9% |
| Interquartile 25% (IQ1) | 5.2% | 3.5% |
| Interquartile 75% (IQ3) | 10.6% | 8.1% |
| Interquartile Range (IQR) | 5.5% | 4.6% |
| Standard Deviation (Sample) | 5.2% | 3.2% |
| Standard Deviation (Population) | 5.2% | 3.1% |
Demographics Similar to Bulgarians and Immigrants from Uganda by 4 or more Vehicles in Household
In terms of 4 or more vehicles in household, the demographic groups most similar to Bulgarians are Ethiopian (5.8%, a difference of 0.040%), Immigrants from Czechoslovakia (5.8%, a difference of 0.050%), Immigrants from Middle Africa (5.8%, a difference of 0.24%), Mongolian (5.8%, a difference of 0.45%), and Immigrants from Poland (5.8%, a difference of 0.54%). Similarly, the demographic groups most similar to Immigrants from Uganda are Immigrants from Western Asia (5.9%, a difference of 0.090%), Immigrants from Singapore (5.9%, a difference of 0.13%), Eastern European (5.9%, a difference of 0.28%), Immigrants from Malaysia (5.9%, a difference of 0.35%), and Immigrants from Switzerland (5.9%, a difference of 0.47%).
| Demographics | Rating | Rank | 4 or more Vehicles in Household |
| Immigrants | Singapore | 7.9 /100 | #226 | Tragic 5.9% |
| Immigrants | Western Asia | 7.8 /100 | #227 | Tragic 5.9% |
| Immigrants | Uganda | 7.5 /100 | #228 | Tragic 5.9% |
| Eastern Europeans | 6.8 /100 | #229 | Tragic 5.9% |
| Immigrants | Malaysia | 6.7 /100 | #230 | Tragic 5.9% |
| Immigrants | Switzerland | 6.4 /100 | #231 | Tragic 5.9% |
| Immigrants | Argentina | 6.0 /100 | #232 | Tragic 5.9% |
| Sierra Leoneans | 6.0 /100 | #233 | Tragic 5.9% |
| Africans | 4.6 /100 | #234 | Tragic 5.8% |
| Immigrants | Hungary | 4.6 /100 | #235 | Tragic 5.8% |
| Immigrants | Eritrea | 4.5 /100 | #236 | Tragic 5.8% |
| Turks | 4.1 /100 | #237 | Tragic 5.8% |
| Immigrants | Belgium | 4.0 /100 | #238 | Tragic 5.8% |
| Immigrants | Australia | 3.8 /100 | #239 | Tragic 5.8% |
| Immigrants | Poland | 3.8 /100 | #240 | Tragic 5.8% |
| Mongolians | 3.7 /100 | #241 | Tragic 5.8% |
| Immigrants | Middle Africa | 3.4 /100 | #242 | Tragic 5.8% |
| Immigrants | Czechoslovakia | 3.2 /100 | #243 | Tragic 5.8% |
| Ethiopians | 3.2 /100 | #244 | Tragic 5.8% |
| Bulgarians | 3.1 /100 | #245 | Tragic 5.8% |
| Immigrants | North Macedonia | 2.5 /100 | #246 | Tragic 5.7% |