Hopi vs Immigrants from Uganda Vision Disability
COMPARE
Hopi
Immigrants from Uganda
Vision Disability
Vision Disability Comparison
Hopi
Immigrants from Uganda
2.9%
VISION DISABILITY
0.0/ 100
METRIC RATING
324th/ 347
METRIC RANK
2.1%
VISION DISABILITY
91.4/ 100
METRIC RATING
119th/ 347
METRIC RANK
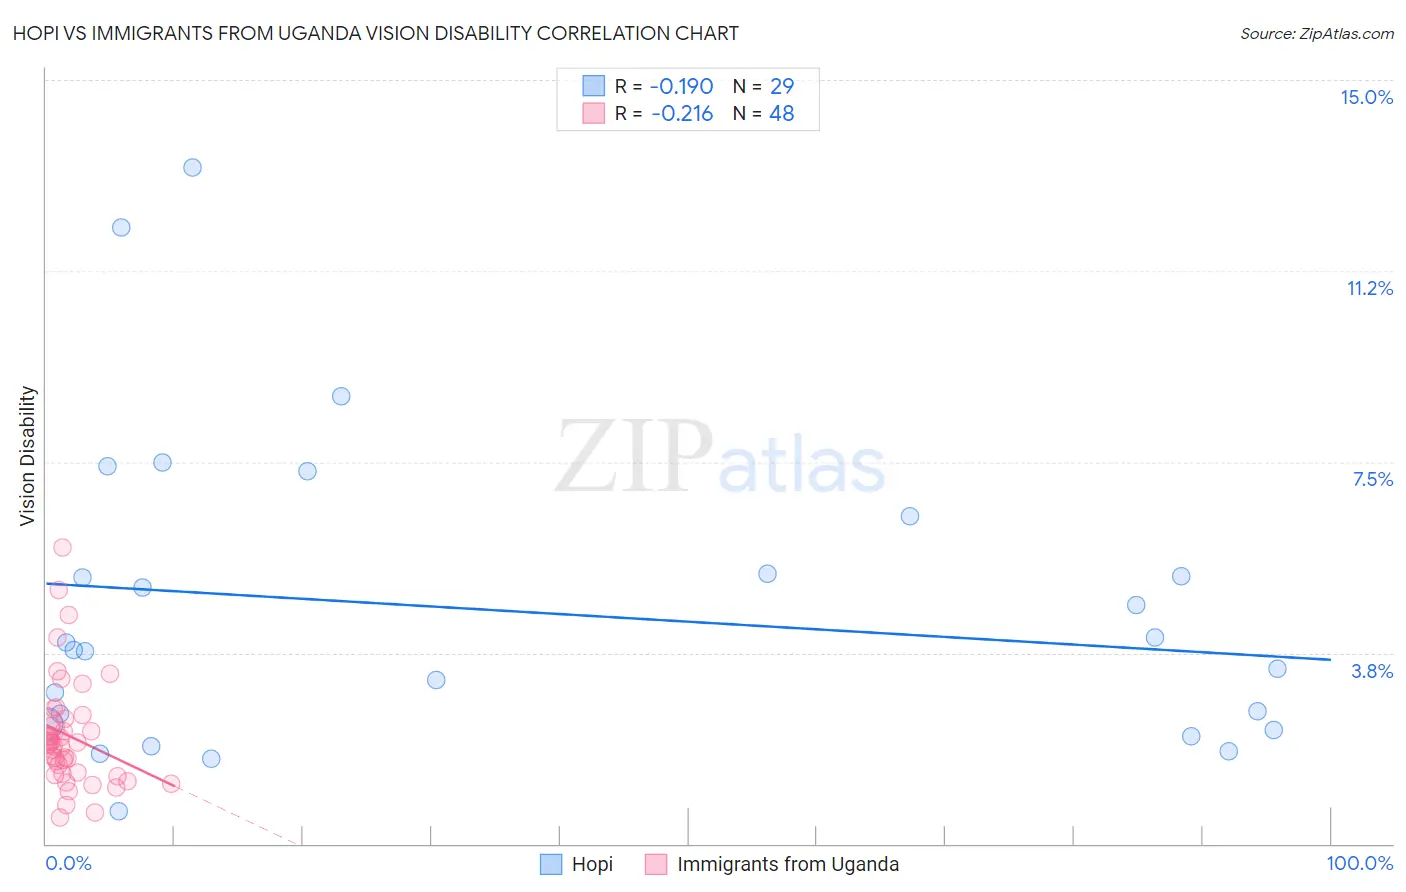
Hopi vs Immigrants from Uganda Vision Disability Correlation Chart
The statistical analysis conducted on geographies consisting of 74,725,197 people shows a poor negative correlation between the proportion of Hopi and percentage of population with vision disability in the United States with a correlation coefficient (R) of -0.190 and weighted average of 2.9%. Similarly, the statistical analysis conducted on geographies consisting of 125,949,603 people shows a weak negative correlation between the proportion of Immigrants from Uganda and percentage of population with vision disability in the United States with a correlation coefficient (R) of -0.216 and weighted average of 2.1%, a difference of 39.6%.
Vision Disability Correlation Summary
| Measurement | Hopi | Immigrants from Uganda |
| Minimum | 0.64% | 0.52% |
| Maximum | 13.3% | 5.8% |
| Range | 12.6% | 5.3% |
| Mean | 4.6% | 2.1% |
| Median | 3.8% | 2.0% |
| Interquartile 25% (IQ1) | 2.3% | 1.4% |
| Interquartile 75% (IQ3) | 5.9% | 2.4% |
| Interquartile Range (IQR) | 3.6% | 0.99% |
| Standard Deviation (Sample) | 3.0% | 1.1% |
| Standard Deviation (Population) | 3.0% | 1.1% |
Similar Demographics by Vision Disability
Demographics Similar to Hopi by Vision Disability
In terms of vision disability, the demographic groups most similar to Hopi are Cherokee (2.9%, a difference of 0.010%), Spanish American (2.9%, a difference of 1.2%), Paiute (2.9%, a difference of 2.0%), Tlingit-Haida (2.9%, a difference of 2.0%), and Native/Alaskan (3.0%, a difference of 2.0%).
| Demographics | Rating | Rank | Vision Disability |
| Yup'ik | 0.0 /100 | #317 | Tragic 2.7% |
| Alaska Natives | 0.0 /100 | #318 | Tragic 2.7% |
| Tohono O'odham | 0.0 /100 | #319 | Tragic 2.8% |
| Blacks/African Americans | 0.0 /100 | #320 | Tragic 2.8% |
| Comanche | 0.0 /100 | #321 | Tragic 2.8% |
| Paiute | 0.0 /100 | #322 | Tragic 2.9% |
| Tlingit-Haida | 0.0 /100 | #323 | Tragic 2.9% |
| Hopi | 0.0 /100 | #324 | Tragic 2.9% |
| Cherokee | 0.0 /100 | #325 | Tragic 2.9% |
| Spanish Americans | 0.0 /100 | #326 | Tragic 2.9% |
| Natives/Alaskans | 0.0 /100 | #327 | Tragic 3.0% |
| Yuman | 0.0 /100 | #328 | Tragic 3.0% |
| Apache | 0.0 /100 | #329 | Tragic 3.0% |
| Colville | 0.0 /100 | #330 | Tragic 3.0% |
| Central American Indians | 0.0 /100 | #331 | Tragic 3.0% |
Demographics Similar to Immigrants from Uganda by Vision Disability
In terms of vision disability, the demographic groups most similar to Immigrants from Uganda are Immigrants from Philippines (2.1%, a difference of 0.0%), Immigrants from Zimbabwe (2.1%, a difference of 0.060%), Polish (2.1%, a difference of 0.14%), Ugandan (2.1%, a difference of 0.18%), and Immigrants from Vietnam (2.1%, a difference of 0.19%).
| Demographics | Rating | Rank | Vision Disability |
| Immigrants | Denmark | 92.9 /100 | #112 | Exceptional 2.1% |
| Kenyans | 92.5 /100 | #113 | Exceptional 2.1% |
| Croatians | 92.3 /100 | #114 | Exceptional 2.1% |
| Immigrants | Vietnam | 92.2 /100 | #115 | Exceptional 2.1% |
| Ugandans | 92.2 /100 | #116 | Exceptional 2.1% |
| Poles | 92.0 /100 | #117 | Exceptional 2.1% |
| Immigrants | Philippines | 91.4 /100 | #118 | Exceptional 2.1% |
| Immigrants | Uganda | 91.4 /100 | #119 | Exceptional 2.1% |
| Immigrants | Zimbabwe | 91.0 /100 | #120 | Exceptional 2.1% |
| Immigrants | Scotland | 90.4 /100 | #121 | Exceptional 2.1% |
| Immigrants | Ukraine | 90.4 /100 | #122 | Exceptional 2.1% |
| Immigrants | Albania | 90.4 /100 | #123 | Exceptional 2.1% |
| Immigrants | Spain | 89.8 /100 | #124 | Excellent 2.1% |
| Immigrants | Venezuela | 89.8 /100 | #125 | Excellent 2.1% |
| Immigrants | Peru | 89.5 /100 | #126 | Excellent 2.1% |