Hopi vs Maltese 4 or more Vehicles in Household
COMPARE
Hopi
Maltese
4 or more Vehicles in Household
4 or more Vehicles in Household Comparison
Hopi
Maltese
6.9%
4 OR MORE VEHICLES IN HOUSEHOLD
97.0/ 100
METRIC RATING
112th/ 347
METRIC RANK
6.7%
4 OR MORE VEHICLES IN HOUSEHOLD
88.4/ 100
METRIC RATING
131st/ 347
METRIC RANK
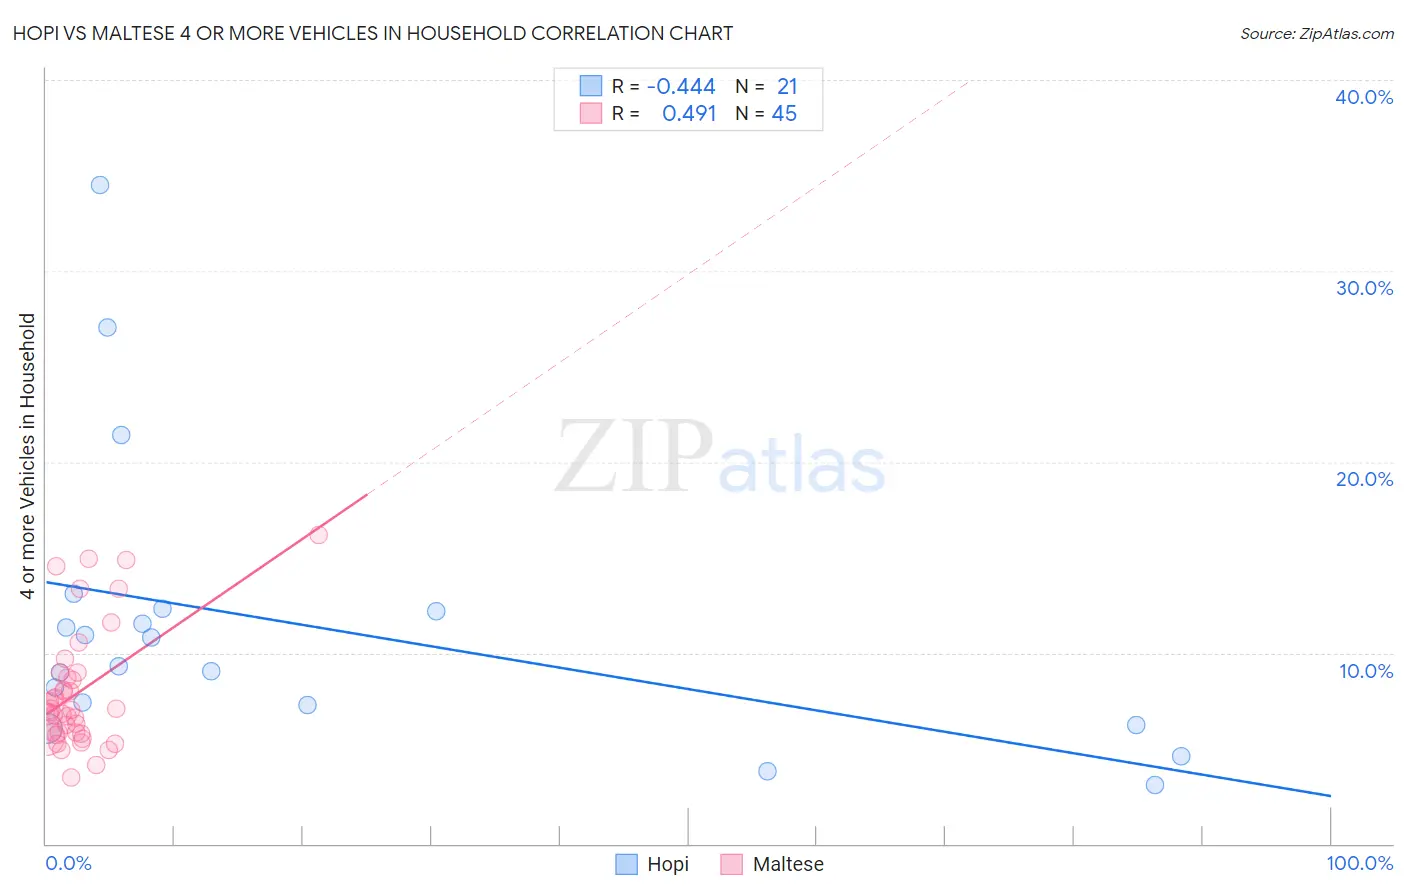
Hopi vs Maltese 4 or more Vehicles in Household Correlation Chart
The statistical analysis conducted on geographies consisting of 74,704,966 people shows a moderate negative correlation between the proportion of Hopi and percentage of households with 4 or more vehicles available in the United States with a correlation coefficient (R) of -0.444 and weighted average of 6.9%. Similarly, the statistical analysis conducted on geographies consisting of 125,931,665 people shows a moderate positive correlation between the proportion of Maltese and percentage of households with 4 or more vehicles available in the United States with a correlation coefficient (R) of 0.491 and weighted average of 6.7%, a difference of 3.4%.
4 or more Vehicles in Household Correlation Summary
| Measurement | Hopi | Maltese |
| Minimum | 3.0% | 3.5% |
| Maximum | 34.5% | 16.2% |
| Range | 31.5% | 12.7% |
| Mean | 11.4% | 7.9% |
| Median | 9.3% | 7.0% |
| Interquartile 25% (IQ1) | 6.8% | 5.8% |
| Interquartile 75% (IQ3) | 12.2% | 8.8% |
| Interquartile Range (IQR) | 5.5% | 3.0% |
| Standard Deviation (Sample) | 7.7% | 3.1% |
| Standard Deviation (Population) | 7.5% | 3.1% |
Demographics Similar to Hopi and Maltese by 4 or more Vehicles in Household
In terms of 4 or more vehicles in household, the demographic groups most similar to Hopi are Aleut (6.9%, a difference of 0.010%), Canadian (6.9%, a difference of 0.42%), Bolivian (6.8%, a difference of 0.47%), Tlingit-Haida (6.8%, a difference of 0.53%), and Immigrants from Guatemala (6.8%, a difference of 0.79%). Similarly, the demographic groups most similar to Maltese are Immigrants from Scotland (6.7%, a difference of 0.15%), Immigrants from England (6.7%, a difference of 0.98%), Immigrants from Bolivia (6.7%, a difference of 1.1%), Immigrants from Korea (6.8%, a difference of 1.7%), and Belgian (6.8%, a difference of 1.8%).
| Demographics | Rating | Rank | 4 or more Vehicles in Household |
| Aleuts | 97.0 /100 | #111 | Exceptional 6.9% |
| Hopi | 97.0 /100 | #112 | Exceptional 6.9% |
| Canadians | 96.4 /100 | #113 | Exceptional 6.9% |
| Bolivians | 96.3 /100 | #114 | Exceptional 6.8% |
| Tlingit-Haida | 96.2 /100 | #115 | Exceptional 6.8% |
| Immigrants | Guatemala | 95.8 /100 | #116 | Exceptional 6.8% |
| Burmese | 95.7 /100 | #117 | Exceptional 6.8% |
| French American Indians | 95.7 /100 | #118 | Exceptional 6.8% |
| Costa Ricans | 95.5 /100 | #119 | Exceptional 6.8% |
| Comanche | 94.8 /100 | #120 | Exceptional 6.8% |
| Immigrants | Germany | 94.7 /100 | #121 | Exceptional 6.8% |
| Immigrants | Nicaragua | 94.7 /100 | #122 | Exceptional 6.8% |
| Immigrants | Immigrants | 94.6 /100 | #123 | Exceptional 6.8% |
| Immigrants | Asia | 94.4 /100 | #124 | Exceptional 6.8% |
| Austrians | 94.1 /100 | #125 | Exceptional 6.8% |
| Belgians | 94.1 /100 | #126 | Exceptional 6.8% |
| Immigrants | Korea | 93.8 /100 | #127 | Exceptional 6.8% |
| Immigrants | Bolivia | 92.5 /100 | #128 | Exceptional 6.7% |
| Immigrants | England | 92.0 /100 | #129 | Exceptional 6.7% |
| Immigrants | Scotland | 89.0 /100 | #130 | Excellent 6.7% |
| Maltese | 88.4 /100 | #131 | Excellent 6.7% |