Immigrants from Eastern Europe vs Immigrants from Uganda 4 or more Vehicles in Household

COMPARE

Immigrants from Eastern Europe
Race
Ancestry
AfghanAfricanAlaska NativeAlaskan AthabascanAlbanianAleutAlsatianAmericanApacheArabArapahoArgentineanArmenianAssyrian/Chaldean/SyriacAustralianAustrianBahamianBangladeshiBarbadianBasqueBelgianBelizeanBermudanBhutaneseBlackfeetBolivianBrazilianBritishBritish West IndianBulgarianBurmeseCajunCambodianCanadianCape VerdeanCarpatho RusynCelticCentral AmericanCentral American IndianCherokeeCheyenneChickasawChileanChineseChippewaChoctawColombianColvilleComancheCosta RicanCreeCreekCroatianCrowCubanCypriotCzechCzechoslovakianDanishDelawareDominicanDutchDutch West IndianEastern EuropeanEcuadorianEgyptianEnglishEstonianEthiopianEuropeanFijianFilipinoFinnishFrenchFrench American IndianFrench CanadianGermanGerman RussianGhanaianGreekGuamanian/ChamorroGuatemalanGuyaneseHaitianHmongHonduranHopiHoumaHungarianIcelanderIndian (Asian)IndonesianInupiatIranianIraqiIrishIroquoisIsraeliItalianJamaicanJapaneseJordanianKenyanKiowaKoreanLaotianLatvianLebaneseLiberianLithuanianLumbeeLuxembourgerMacedonianMalaysianMalteseMarshalleseMenomineeMexicanMexican American IndianMongolianMoroccanNative HawaiianNavajoNepaleseNew ZealanderNicaraguanNigerianNorthern EuropeanNorwegianOkinawanOsageOttawaPaiutePakistaniPalestinianPanamanianParaguayanPennsylvania GermanPeruvianPimaPolishPortuguesePotawatomiPuebloPuerto RicanPuget Sound SalishRomanianRussianSalvadoranSamoanScandinavianScotch-IrishScottishSeminoleSenegaleseSerbianShoshoneSierra LeoneanSiouxSlavicSlovakSloveneSomaliSouth AfricanSouth AmericanSouth American IndianSoviet UnionSpaniardSpanishSpanish AmericanSpanish American IndianSri LankanSubsaharan AfricanSudaneseSwedishSwissSyrianTaiwaneseThaiTlingit-HaidaTohono O'OdhamTonganTrinidadian and TobagonianTsimshianTurkishU.S. Virgin IslanderUgandanUkrainianUruguayanUteVenezuelanVietnameseWelshWest IndianYakamaYaquiYugoslavianYumanYup'ikZimbabwean
Immigration
NonimmigrantsImmigrantsAfghanistanAfricaAlbaniaArgentinaArmeniaAsiaAustraliaAustriaBahamasBangladeshBarbadosBelarusBelgiumBelizeBoliviaBosnia and HerzegovinaBrazilBulgariaBurma/MyanmarCabo VerdeCambodiaCameroonCanadaCaribbeanCentral AmericaChileChinaColombiaCongoCosta RicaCroatiaCubaCzechoslovakiaDenmarkDominicaDominican RepublicEastern AfricaEastern AsiaEastern EuropeEcuadorEgyptEl SalvadorEnglandEritreaEthiopiaEuropeFijiFranceGermanyGhanaGreeceGrenadaGuatemalaGuyanaHaitiHondurasHong KongHungaryIndiaIndonesiaIranIraqIrelandIsraelItalyJamaicaJapanJordanKazakhstanKenyaKoreaKuwaitLaosLatin AmericaLatviaLebanonLiberiaLithuaniaMalaysiaMexicoMicronesiaMiddle AfricaMoldovaMoroccoNepalNetherlandsNicaraguaNigeriaNorth AmericaNorth MacedoniaNorthern AfricaNorthern EuropeNorwayOceaniaPakistanPanamaPeruPhilippinesPolandPortugalRomaniaRussiaSaudi ArabiaScotlandSenegalSerbiaSierra LeoneSingaporeSomaliaSouth AfricaSouth AmericaSouth Central AsiaSouth Eastern AsiaSouthern EuropeSpainSri LankaSt. Vincent and the GrenadinesSudanSwedenSwitzerlandSyriaTaiwanThailandTrinidad and TobagoTurkeyUkraineUruguayUzbekistanVenezuelaVietnamWest IndiesWestern AfricaWestern AsiaWestern EuropeYemenZaireZimbabweAzores
Immigrants from Uganda
Race
Ancestry
AfghanAfricanAlaska NativeAlaskan AthabascanAlbanianAleutAlsatianAmericanApacheArabArapahoArgentineanArmenianAssyrian/Chaldean/SyriacAustralianAustrianBahamianBangladeshiBarbadianBasqueBelgianBelizeanBermudanBhutaneseBlackfeetBolivianBrazilianBritishBritish West IndianBulgarianBurmeseCajunCambodianCanadianCape VerdeanCarpatho RusynCelticCentral AmericanCentral American IndianCherokeeCheyenneChickasawChileanChineseChippewaChoctawColombianColvilleComancheCosta RicanCreeCreekCroatianCrowCubanCypriotCzechCzechoslovakianDanishDelawareDominicanDutchDutch West IndianEastern EuropeanEcuadorianEgyptianEnglishEstonianEthiopianEuropeanFijianFilipinoFinnishFrenchFrench American IndianFrench CanadianGermanGerman RussianGhanaianGreekGuamanian/ChamorroGuatemalanGuyaneseHaitianHmongHonduranHopiHoumaHungarianIcelanderIndian (Asian)IndonesianInupiatIranianIraqiIrishIroquoisIsraeliItalianJamaicanJapaneseJordanianKenyanKiowaKoreanLaotianLatvianLebaneseLiberianLithuanianLumbeeLuxembourgerMacedonianMalaysianMalteseMarshalleseMenomineeMexicanMexican American IndianMongolianMoroccanNative HawaiianNavajoNepaleseNew ZealanderNicaraguanNigerianNorthern EuropeanNorwegianOkinawanOsageOttawaPaiutePakistaniPalestinianPanamanianParaguayanPennsylvania GermanPeruvianPimaPolishPortuguesePotawatomiPuebloPuerto RicanPuget Sound SalishRomanianRussianSalvadoranSamoanScandinavianScotch-IrishScottishSeminoleSenegaleseSerbianShoshoneSierra LeoneanSiouxSlavicSlovakSloveneSomaliSouth AfricanSouth AmericanSouth American IndianSoviet UnionSpaniardSpanishSpanish AmericanSpanish American IndianSri LankanSubsaharan AfricanSudaneseSwedishSwissSyrianTaiwaneseThaiTlingit-HaidaTohono O'OdhamTonganTrinidadian and TobagonianTsimshianTurkishU.S. Virgin IslanderUgandanUkrainianUruguayanUteVenezuelanVietnameseWelshWest IndianYakamaYaquiYugoslavianYumanYup'ikZimbabwean
Immigration
NonimmigrantsImmigrantsAfghanistanAfricaAlbaniaArgentinaArmeniaAsiaAustraliaAustriaBahamasBangladeshBarbadosBelarusBelgiumBelizeBoliviaBosnia and HerzegovinaBrazilBulgariaBurma/MyanmarCabo VerdeCambodiaCameroonCanadaCaribbeanCentral AmericaChileChinaColombiaCongoCosta RicaCroatiaCubaCzechoslovakiaDenmarkDominicaDominican RepublicEastern AfricaEastern AsiaEcuadorEgyptEl SalvadorEnglandEritreaEthiopiaEuropeFijiFranceGermanyGhanaGreeceGrenadaGuatemalaGuyanaHaitiHondurasHong KongHungaryIndiaIndonesiaIranIraqIrelandIsraelItalyJamaicaJapanJordanKazakhstanKenyaKoreaKuwaitLaosLatin AmericaLatviaLebanonLiberiaLithuaniaMalaysiaMexicoMicronesiaMiddle AfricaMoldovaMoroccoNepalNetherlandsNicaraguaNigeriaNorth AmericaNorth MacedoniaNorthern AfricaNorthern EuropeNorwayOceaniaPakistanPanamaPeruPhilippinesPolandPortugalRomaniaRussiaSaudi ArabiaScotlandSenegalSerbiaSierra LeoneSingaporeSomaliaSouth AfricaSouth AmericaSouth Central AsiaSouth Eastern AsiaSouthern EuropeSpainSri LankaSt. Vincent and the GrenadinesSudanSwedenSwitzerlandSyriaTaiwanThailandTrinidad and TobagoTurkeyUgandaUkraineUruguayUzbekistanVenezuelaVietnamWest IndiesWestern AfricaWestern AsiaWestern EuropeYemenZaireZimbabweAzores
4 or more Vehicles in Household
Income
Poverty
Unemployment
Labor Participation
Family Structure
Vehicle Availability
Education Level
Disability

4 or more Vehicles in Household Comparison

Immigrants from Eastern Europe

Immigrants from Uganda

Tragic
Tragic
5.4%
4 OR MORE VEHICLES IN HOUSEHOLD
0.4/ 100
METRIC RATING
278th/ 347
METRIC RANK
5.9%
4 OR MORE VEHICLES IN HOUSEHOLD
7.5/ 100
METRIC RATING
228th/ 347
METRIC RANK

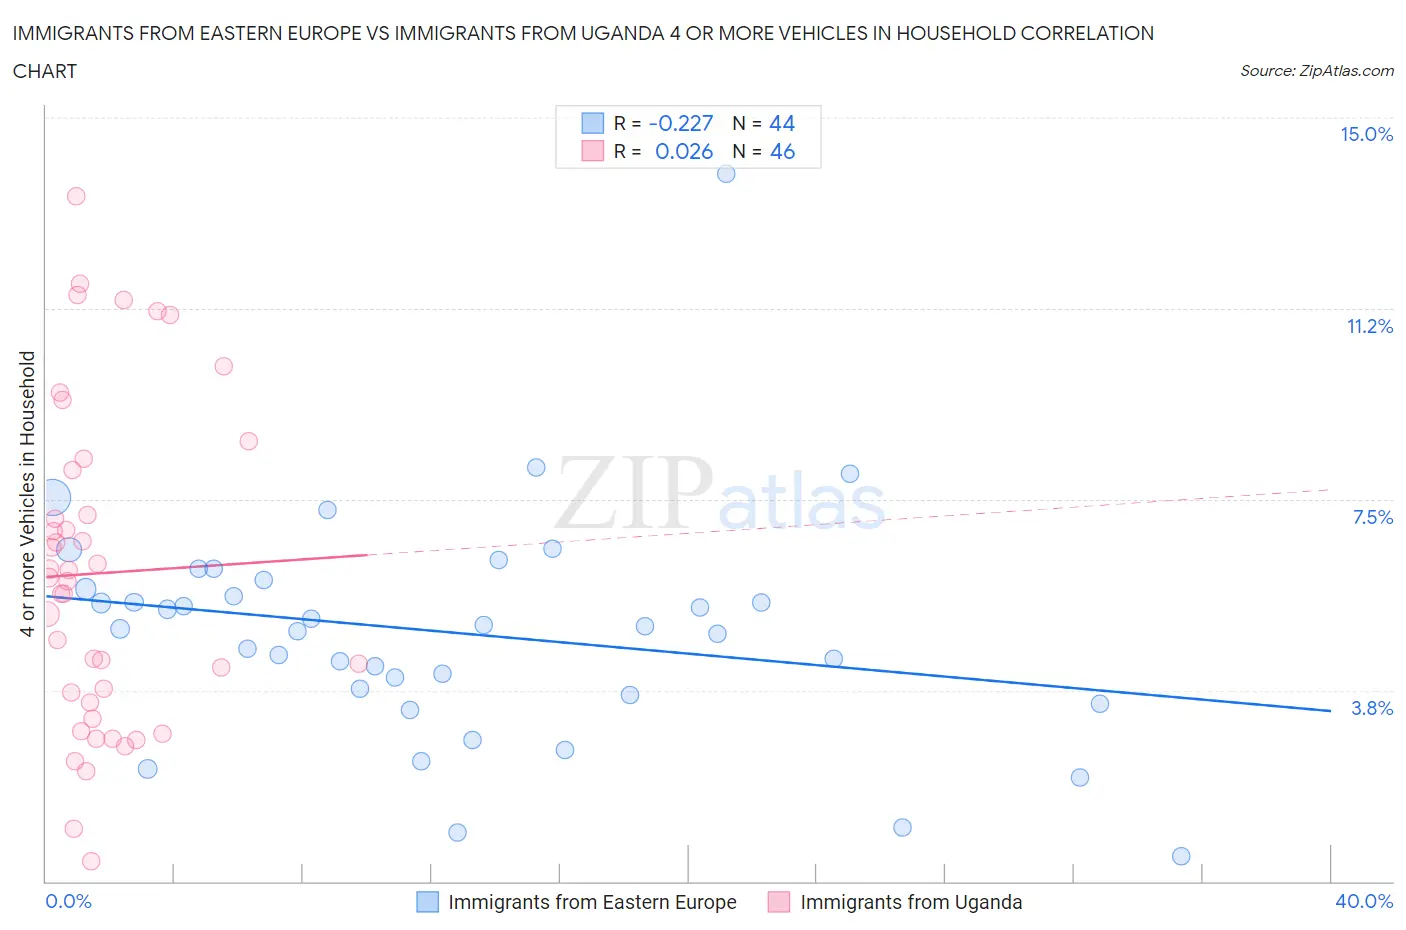
Immigrants from Eastern Europe vs Immigrants from Uganda 4 or more Vehicles in Household Correlation Chart

The statistical analysis conducted on geographies consisting of 473,333,841 people shows a weak negative correlation between the proportion of Immigrants from Eastern Europe and percentage of households with 4 or more vehicles available in the United States with a correlation coefficient (R) of -0.227 and weighted average of 5.4%. Similarly, the statistical analysis conducted on geographies consisting of 125,864,473 people shows no correlation between the proportion of Immigrants from Uganda and percentage of households with 4 or more vehicles available in the United States with a correlation coefficient (R) of 0.026 and weighted average of 5.9%, a difference of 9.0%.
Immigrants from Eastern Europe vs Immigrants from Uganda 4 or more Vehicles in Household

4 or more Vehicles in Household Correlation Summary

MeasurementImmigrants from Eastern EuropeImmigrants from Uganda
Minimum0.50%0.38%
Maximum13.9%13.5%
Range13.4%13.1%
Mean4.9%6.1%
Median5.0%5.9%
Interquartile 25% (IQ1)3.7%3.5%
Interquartile 75% (IQ3)5.8%8.1%
Interquartile Range (IQR)2.1%4.6%
Standard Deviation (Sample)2.3%3.2%
Standard Deviation (Population)2.2%3.1%

Similar Demographics by 4 or more Vehicles in Household

Demographics Similar to Immigrants from Eastern Europe by 4 or more Vehicles in Household

In terms of 4 or more vehicles in household, the demographic groups most similar to Immigrants from Eastern Europe are Immigrants from Uruguay (5.4%, a difference of 0.46%), Alsatian (5.4%, a difference of 0.47%), Immigrants from Western Africa (5.4%, a difference of 0.54%), Immigrants from Spain (5.4%, a difference of 0.71%), and Immigrants from Ireland (5.4%, a difference of 0.79%).
DemographicsRating | Rank4 or more Vehicles in Household
Immigrants | Sudan
0.6
/100
|
#271
Tragic
5.5%
Immigrants | Kazakhstan
0.6
/100
|
#272
Tragic
5.5%
Macedonians
0.6
/100
|
#273
Tragic
5.5%
Blacks/African Americans
0.6
/100
|
#274
Tragic
5.5%
Cambodians
0.5
/100
|
#275
Tragic
5.5%
Immigrants | Latvia
0.5
/100
|
#276
Tragic
5.5%
Immigrants | Bulgaria
0.5
/100
|
#277
Tragic
5.5%
Immigrants | Eastern Europe
0.4
/100
|
#278
Tragic
5.4%
Immigrants | Uruguay
0.3
/100
|
#279
Tragic
5.4%
Alsatians
0.3
/100
|
#280
Tragic
5.4%
Immigrants | Western Africa
0.3
/100
|
#281
Tragic
5.4%
Immigrants | Spain
0.3
/100
|
#282
Tragic
5.4%
Immigrants | Ireland
0.3
/100
|
#283
Tragic
5.4%
Brazilians
0.3
/100
|
#284
Tragic
5.4%
Immigrants | Liberia
0.2
/100
|
#285
Tragic
5.4%

Demographics Similar to Immigrants from Uganda by 4 or more Vehicles in Household

In terms of 4 or more vehicles in household, the demographic groups most similar to Immigrants from Uganda are Immigrants from Western Asia (5.9%, a difference of 0.090%), Immigrants from Singapore (5.9%, a difference of 0.13%), Eastern European (5.9%, a difference of 0.28%), Immigrants from Malaysia (5.9%, a difference of 0.35%), and Immigrants from Switzerland (5.9%, a difference of 0.47%).
DemographicsRating | Rank4 or more Vehicles in Household
Immigrants | Moldova
9.3
/100
|
#221
Tragic
6.0%
Cajuns
9.2
/100
|
#222
Tragic
6.0%
Immigrants | Kenya
9.2
/100
|
#223
Tragic
6.0%
Cubans
9.2
/100
|
#224
Tragic
6.0%
Indonesians
8.9
/100
|
#225
Tragic
6.0%
Immigrants | Singapore
7.9
/100
|
#226
Tragic
5.9%
Immigrants | Western Asia
7.8
/100
|
#227
Tragic
5.9%
Immigrants | Uganda
7.5
/100
|
#228
Tragic
5.9%
Eastern Europeans
6.8
/100
|
#229
Tragic
5.9%
Immigrants | Malaysia
6.7
/100
|
#230
Tragic
5.9%
Immigrants | Switzerland
6.4
/100
|
#231
Tragic
5.9%
Immigrants | Argentina
6.0
/100
|
#232
Tragic
5.9%
Sierra Leoneans
6.0
/100
|
#233
Tragic
5.9%
Africans
4.6
/100
|
#234
Tragic
5.8%
Immigrants | Hungary
4.6
/100
|
#235
Tragic
5.8%