Puerto Rican vs Immigrants from Uganda 4 or more Vehicles in Household
COMPARE
Puerto Rican
Immigrants from Uganda
4 or more Vehicles in Household
4 or more Vehicles in Household Comparison
Puerto Ricans
Immigrants from Uganda
4.7%
4 OR MORE VEHICLES IN HOUSEHOLD
0.0/ 100
METRIC RATING
316th/ 347
METRIC RANK
5.9%
4 OR MORE VEHICLES IN HOUSEHOLD
7.5/ 100
METRIC RATING
228th/ 347
METRIC RANK
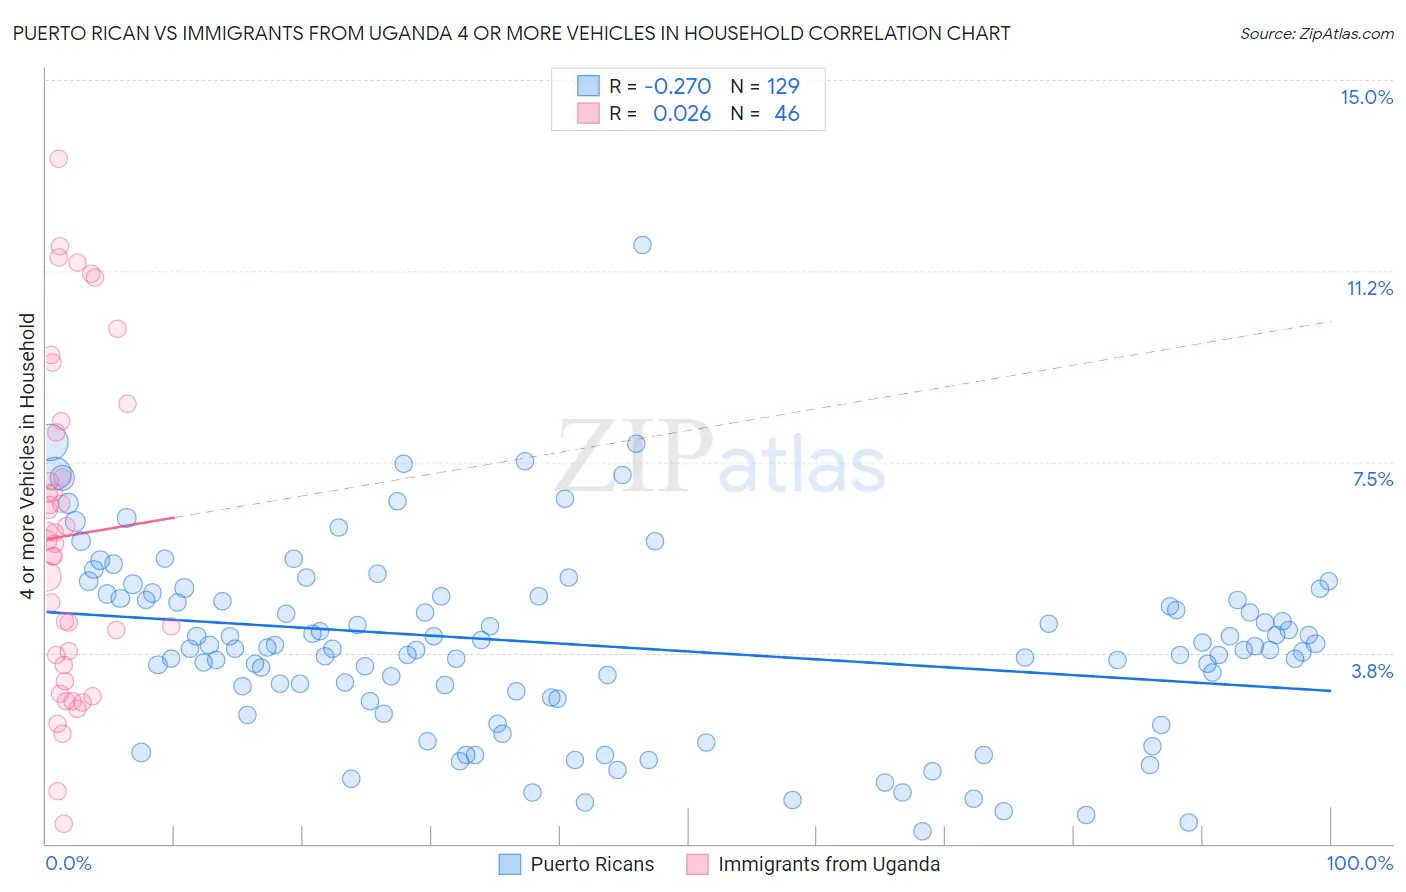
Puerto Rican vs Immigrants from Uganda 4 or more Vehicles in Household Correlation Chart
The statistical analysis conducted on geographies consisting of 525,186,589 people shows a weak negative correlation between the proportion of Puerto Ricans and percentage of households with 4 or more vehicles available in the United States with a correlation coefficient (R) of -0.270 and weighted average of 4.7%. Similarly, the statistical analysis conducted on geographies consisting of 125,864,473 people shows no correlation between the proportion of Immigrants from Uganda and percentage of households with 4 or more vehicles available in the United States with a correlation coefficient (R) of 0.026 and weighted average of 5.9%, a difference of 25.5%.
4 or more Vehicles in Household Correlation Summary
| Measurement | Puerto Rican | Immigrants from Uganda |
| Minimum | 0.24% | 0.38% |
| Maximum | 11.8% | 13.5% |
| Range | 11.5% | 13.1% |
| Mean | 3.9% | 6.1% |
| Median | 3.8% | 5.9% |
| Interquartile 25% (IQ1) | 2.9% | 3.5% |
| Interquartile 75% (IQ3) | 4.9% | 8.1% |
| Interquartile Range (IQR) | 2.0% | 4.6% |
| Standard Deviation (Sample) | 1.8% | 3.2% |
| Standard Deviation (Population) | 1.8% | 3.1% |
Similar Demographics by 4 or more Vehicles in Household
Demographics Similar to Puerto Ricans by 4 or more Vehicles in Household
In terms of 4 or more vehicles in household, the demographic groups most similar to Puerto Ricans are Immigrants from Belarus (4.7%, a difference of 0.44%), Immigrants from West Indies (4.7%, a difference of 0.53%), Immigrants from Israel (4.8%, a difference of 1.3%), Albanian (4.8%, a difference of 1.3%), and U.S. Virgin Islander (4.6%, a difference of 1.7%).
| Demographics | Rating | Rank | 4 or more Vehicles in Household |
| Immigrants | Somalia | 0.0 /100 | #309 | Tragic 4.9% |
| Moroccans | 0.0 /100 | #310 | Tragic 4.9% |
| Houma | 0.0 /100 | #311 | Tragic 4.9% |
| Albanians | 0.0 /100 | #312 | Tragic 4.8% |
| Immigrants | Israel | 0.0 /100 | #313 | Tragic 4.8% |
| Immigrants | West Indies | 0.0 /100 | #314 | Tragic 4.7% |
| Immigrants | Belarus | 0.0 /100 | #315 | Tragic 4.7% |
| Puerto Ricans | 0.0 /100 | #316 | Tragic 4.7% |
| U.S. Virgin Islanders | 0.0 /100 | #317 | Tragic 4.6% |
| Jamaicans | 0.0 /100 | #318 | Tragic 4.6% |
| Haitians | 0.0 /100 | #319 | Tragic 4.6% |
| Immigrants | Haiti | 0.0 /100 | #320 | Tragic 4.5% |
| Ecuadorians | 0.0 /100 | #321 | Tragic 4.5% |
| Immigrants | Yemen | 0.0 /100 | #322 | Tragic 4.5% |
| Immigrants | Caribbean | 0.0 /100 | #323 | Tragic 4.4% |
Demographics Similar to Immigrants from Uganda by 4 or more Vehicles in Household
In terms of 4 or more vehicles in household, the demographic groups most similar to Immigrants from Uganda are Immigrants from Western Asia (5.9%, a difference of 0.090%), Immigrants from Singapore (5.9%, a difference of 0.13%), Eastern European (5.9%, a difference of 0.28%), Immigrants from Malaysia (5.9%, a difference of 0.35%), and Immigrants from Switzerland (5.9%, a difference of 0.47%).
| Demographics | Rating | Rank | 4 or more Vehicles in Household |
| Immigrants | Moldova | 9.3 /100 | #221 | Tragic 6.0% |
| Cajuns | 9.2 /100 | #222 | Tragic 6.0% |
| Immigrants | Kenya | 9.2 /100 | #223 | Tragic 6.0% |
| Cubans | 9.2 /100 | #224 | Tragic 6.0% |
| Indonesians | 8.9 /100 | #225 | Tragic 6.0% |
| Immigrants | Singapore | 7.9 /100 | #226 | Tragic 5.9% |
| Immigrants | Western Asia | 7.8 /100 | #227 | Tragic 5.9% |
| Immigrants | Uganda | 7.5 /100 | #228 | Tragic 5.9% |
| Eastern Europeans | 6.8 /100 | #229 | Tragic 5.9% |
| Immigrants | Malaysia | 6.7 /100 | #230 | Tragic 5.9% |
| Immigrants | Switzerland | 6.4 /100 | #231 | Tragic 5.9% |
| Immigrants | Argentina | 6.0 /100 | #232 | Tragic 5.9% |
| Sierra Leoneans | 6.0 /100 | #233 | Tragic 5.9% |
| Africans | 4.6 /100 | #234 | Tragic 5.8% |
| Immigrants | Hungary | 4.6 /100 | #235 | Tragic 5.8% |