Delaware vs Immigrants from Uganda 4 or more Vehicles in Household
COMPARE
Delaware
Immigrants from Uganda
4 or more Vehicles in Household
4 or more Vehicles in Household Comparison
Delaware
Immigrants from Uganda
7.2%
4 OR MORE VEHICLES IN HOUSEHOLD
99.6/ 100
METRIC RATING
87th/ 347
METRIC RANK
5.9%
4 OR MORE VEHICLES IN HOUSEHOLD
7.5/ 100
METRIC RATING
228th/ 347
METRIC RANK
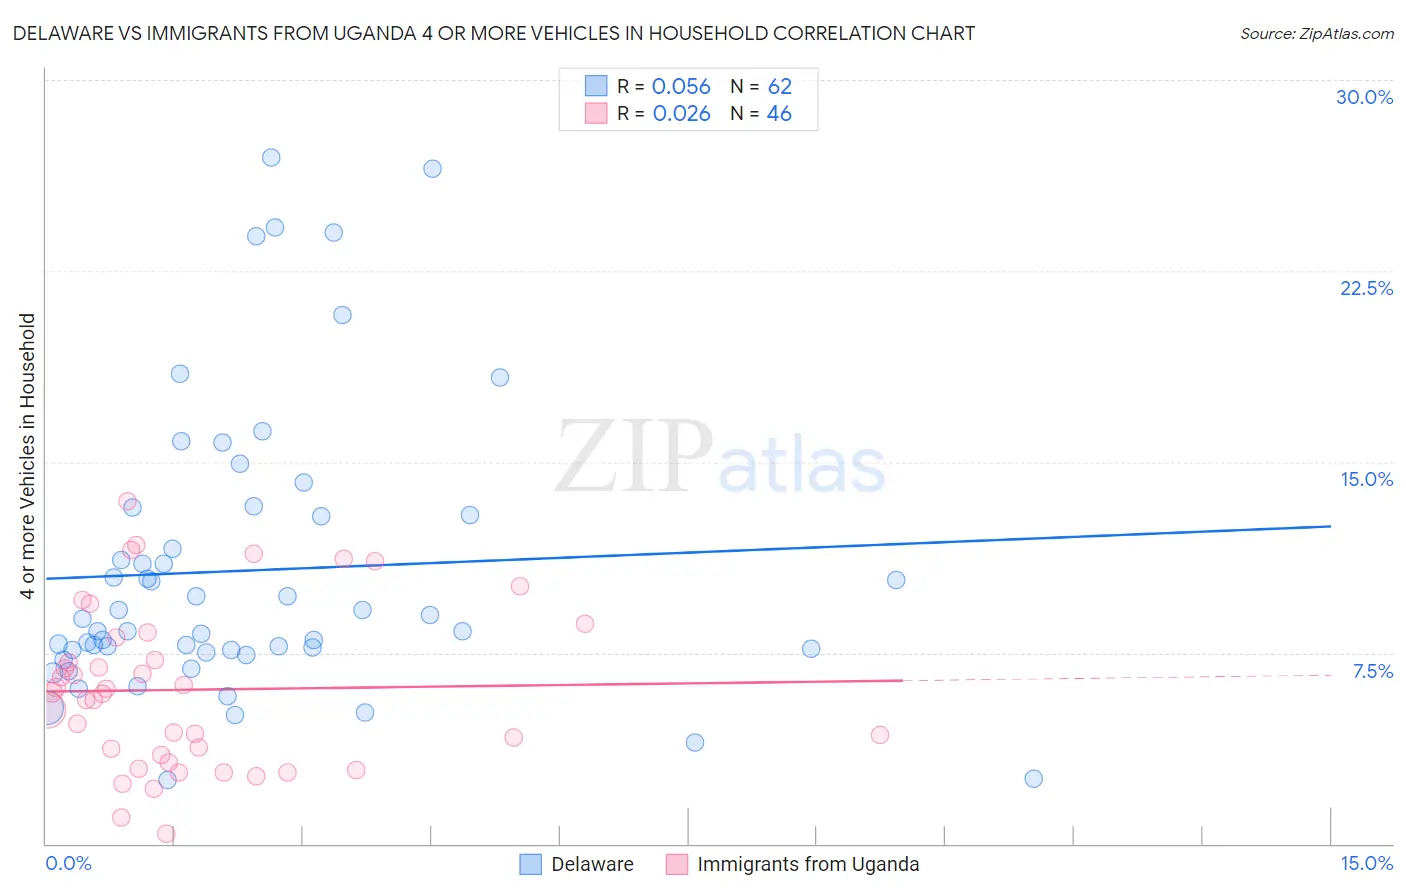
Delaware vs Immigrants from Uganda 4 or more Vehicles in Household Correlation Chart
The statistical analysis conducted on geographies consisting of 96,077,939 people shows a slight positive correlation between the proportion of Delaware and percentage of households with 4 or more vehicles available in the United States with a correlation coefficient (R) of 0.056 and weighted average of 7.2%. Similarly, the statistical analysis conducted on geographies consisting of 125,864,473 people shows no correlation between the proportion of Immigrants from Uganda and percentage of households with 4 or more vehicles available in the United States with a correlation coefficient (R) of 0.026 and weighted average of 5.9%, a difference of 22.0%.
4 or more Vehicles in Household Correlation Summary
| Measurement | Delaware | Immigrants from Uganda |
| Minimum | 2.5% | 0.38% |
| Maximum | 27.0% | 13.5% |
| Range | 24.5% | 13.1% |
| Mean | 10.7% | 6.1% |
| Median | 8.6% | 5.9% |
| Interquartile 25% (IQ1) | 7.6% | 3.5% |
| Interquartile 75% (IQ3) | 12.9% | 8.1% |
| Interquartile Range (IQR) | 5.3% | 4.6% |
| Standard Deviation (Sample) | 5.7% | 3.2% |
| Standard Deviation (Population) | 5.6% | 3.1% |
Similar Demographics by 4 or more Vehicles in Household
Demographics Similar to Delaware by 4 or more Vehicles in Household
In terms of 4 or more vehicles in household, the demographic groups most similar to Delaware are Nonimmigrants (7.2%, a difference of 0.020%), Immigrants from Indonesia (7.2%, a difference of 0.060%), Cree (7.2%, a difference of 0.24%), British (7.2%, a difference of 0.35%), and Afghan (7.3%, a difference of 0.41%).
| Demographics | Rating | Rank | 4 or more Vehicles in Household |
| Alaska Natives | 99.8 /100 | #80 | Exceptional 7.3% |
| Finns | 99.8 /100 | #81 | Exceptional 7.3% |
| Northern Europeans | 99.8 /100 | #82 | Exceptional 7.3% |
| Potawatomi | 99.7 /100 | #83 | Exceptional 7.3% |
| Afghans | 99.7 /100 | #84 | Exceptional 7.3% |
| Cree | 99.7 /100 | #85 | Exceptional 7.2% |
| Immigrants | Indonesia | 99.6 /100 | #86 | Exceptional 7.2% |
| Delaware | 99.6 /100 | #87 | Exceptional 7.2% |
| Immigrants | Nonimmigrants | 99.6 /100 | #88 | Exceptional 7.2% |
| British | 99.6 /100 | #89 | Exceptional 7.2% |
| Creek | 99.6 /100 | #90 | Exceptional 7.2% |
| Assyrians/Chaldeans/Syriacs | 99.4 /100 | #91 | Exceptional 7.2% |
| Immigrants | Latin America | 99.4 /100 | #92 | Exceptional 7.1% |
| Immigrants | Afghanistan | 99.3 /100 | #93 | Exceptional 7.1% |
| Dutch West Indians | 99.3 /100 | #94 | Exceptional 7.1% |
Demographics Similar to Immigrants from Uganda by 4 or more Vehicles in Household
In terms of 4 or more vehicles in household, the demographic groups most similar to Immigrants from Uganda are Immigrants from Western Asia (5.9%, a difference of 0.090%), Immigrants from Singapore (5.9%, a difference of 0.13%), Eastern European (5.9%, a difference of 0.28%), Immigrants from Malaysia (5.9%, a difference of 0.35%), and Immigrants from Switzerland (5.9%, a difference of 0.47%).
| Demographics | Rating | Rank | 4 or more Vehicles in Household |
| Immigrants | Moldova | 9.3 /100 | #221 | Tragic 6.0% |
| Cajuns | 9.2 /100 | #222 | Tragic 6.0% |
| Immigrants | Kenya | 9.2 /100 | #223 | Tragic 6.0% |
| Cubans | 9.2 /100 | #224 | Tragic 6.0% |
| Indonesians | 8.9 /100 | #225 | Tragic 6.0% |
| Immigrants | Singapore | 7.9 /100 | #226 | Tragic 5.9% |
| Immigrants | Western Asia | 7.8 /100 | #227 | Tragic 5.9% |
| Immigrants | Uganda | 7.5 /100 | #228 | Tragic 5.9% |
| Eastern Europeans | 6.8 /100 | #229 | Tragic 5.9% |
| Immigrants | Malaysia | 6.7 /100 | #230 | Tragic 5.9% |
| Immigrants | Switzerland | 6.4 /100 | #231 | Tragic 5.9% |
| Immigrants | Argentina | 6.0 /100 | #232 | Tragic 5.9% |
| Sierra Leoneans | 6.0 /100 | #233 | Tragic 5.9% |
| Africans | 4.6 /100 | #234 | Tragic 5.8% |
| Immigrants | Hungary | 4.6 /100 | #235 | Tragic 5.8% |