Honduran vs Macedonian In Labor Force | Age 16-19
COMPARE
Honduran
Macedonian
In Labor Force | Age 16-19
In Labor Force | Age 16-19 Comparison
Hondurans
Macedonians
35.3%
IN LABOR FORCE | AGE 16-19
6.5/ 100
METRIC RATING
224th/ 347
METRIC RANK
37.8%
IN LABOR FORCE | AGE 16-19
93.4/ 100
METRIC RATING
135th/ 347
METRIC RANK
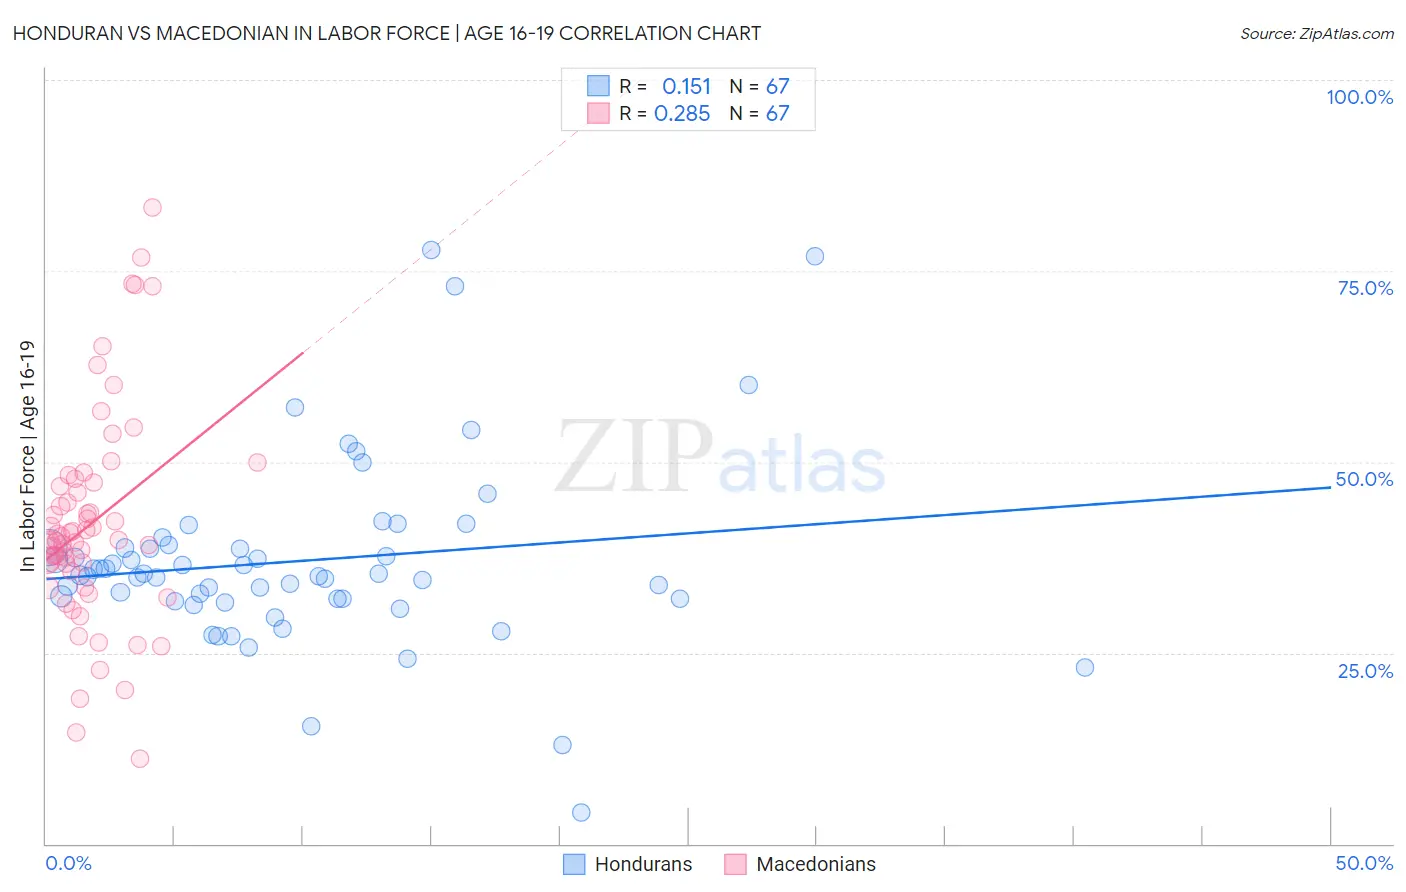
Honduran vs Macedonian In Labor Force | Age 16-19 Correlation Chart
The statistical analysis conducted on geographies consisting of 357,451,024 people shows a poor positive correlation between the proportion of Hondurans and labor force participation rate among population between the ages 16 and 19 in the United States with a correlation coefficient (R) of 0.151 and weighted average of 35.3%. Similarly, the statistical analysis conducted on geographies consisting of 132,590,636 people shows a weak positive correlation between the proportion of Macedonians and labor force participation rate among population between the ages 16 and 19 in the United States with a correlation coefficient (R) of 0.285 and weighted average of 37.8%, a difference of 6.9%.
In Labor Force | Age 16-19 Correlation Summary
| Measurement | Honduran | Macedonian |
| Minimum | 4.1% | 11.2% |
| Maximum | 77.8% | 83.3% |
| Range | 73.7% | 72.1% |
| Mean | 37.0% | 41.9% |
| Median | 35.1% | 39.8% |
| Interquartile 25% (IQ1) | 32.0% | 35.7% |
| Interquartile 75% (IQ3) | 38.8% | 47.3% |
| Interquartile Range (IQR) | 6.8% | 11.5% |
| Standard Deviation (Sample) | 12.4% | 14.1% |
| Standard Deviation (Population) | 12.3% | 13.9% |
Similar Demographics by In Labor Force | Age 16-19
Demographics Similar to Hondurans by In Labor Force | Age 16-19
In terms of in labor force | age 16-19, the demographic groups most similar to Hondurans are Ghanaian (35.3%, a difference of 0.020%), Immigrants from Belgium (35.3%, a difference of 0.080%), Immigrants from Ghana (35.4%, a difference of 0.16%), Turkish (35.4%, a difference of 0.17%), and Immigrants from Guatemala (35.3%, a difference of 0.17%).
| Demographics | Rating | Rank | In Labor Force | Age 16-19 |
| Immigrants | Costa Rica | 10.7 /100 | #217 | Poor 35.6% |
| Sri Lankans | 9.8 /100 | #218 | Tragic 35.5% |
| Guatemalans | 8.6 /100 | #219 | Tragic 35.5% |
| Immigrants | Bahamas | 8.3 /100 | #220 | Tragic 35.5% |
| Turks | 7.3 /100 | #221 | Tragic 35.4% |
| Immigrants | Ghana | 7.3 /100 | #222 | Tragic 35.4% |
| Ghanaians | 6.5 /100 | #223 | Tragic 35.3% |
| Hondurans | 6.5 /100 | #224 | Tragic 35.3% |
| Immigrants | Belgium | 6.1 /100 | #225 | Tragic 35.3% |
| Immigrants | Guatemala | 5.7 /100 | #226 | Tragic 35.3% |
| Mongolians | 5.7 /100 | #227 | Tragic 35.3% |
| Immigrants | Senegal | 5.5 /100 | #228 | Tragic 35.3% |
| Immigrants | Lebanon | 5.0 /100 | #229 | Tragic 35.2% |
| Immigrants | Honduras | 4.9 /100 | #230 | Tragic 35.2% |
| Immigrants | Syria | 4.5 /100 | #231 | Tragic 35.2% |
Demographics Similar to Macedonians by In Labor Force | Age 16-19
In terms of in labor force | age 16-19, the demographic groups most similar to Macedonians are Australian (37.8%, a difference of 0.030%), Cajun (37.8%, a difference of 0.030%), Immigrants from Netherlands (37.8%, a difference of 0.060%), Comanche (37.7%, a difference of 0.26%), and Cheyenne (37.9%, a difference of 0.27%).
| Demographics | Rating | Rank | In Labor Force | Age 16-19 |
| New Zealanders | 95.6 /100 | #128 | Exceptional 38.0% |
| Spaniards | 95.5 /100 | #129 | Exceptional 38.0% |
| Immigrants | Zimbabwe | 95.4 /100 | #130 | Exceptional 38.0% |
| Immigrants | Austria | 95.0 /100 | #131 | Exceptional 37.9% |
| Immigrants | Oceania | 94.7 /100 | #132 | Exceptional 37.9% |
| Cheyenne | 94.6 /100 | #133 | Exceptional 37.9% |
| Immigrants | Netherlands | 93.7 /100 | #134 | Exceptional 37.8% |
| Macedonians | 93.4 /100 | #135 | Exceptional 37.8% |
| Australians | 93.2 /100 | #136 | Exceptional 37.8% |
| Cajuns | 93.2 /100 | #137 | Exceptional 37.8% |
| Comanche | 91.9 /100 | #138 | Exceptional 37.7% |
| Immigrants | Moldova | 91.9 /100 | #139 | Exceptional 37.7% |
| Estonians | 91.7 /100 | #140 | Exceptional 37.7% |
| Syrians | 90.7 /100 | #141 | Exceptional 37.6% |
| Sierra Leoneans | 89.7 /100 | #142 | Excellent 37.6% |