Czech vs Macedonian 3 or more Vehicles in Household
COMPARE
Czech
Macedonian
3 or more Vehicles in Household
3 or more Vehicles in Household Comparison
Czechs
Macedonians
22.5%
3 OR MORE VEHICLES IN HOUSEHOLD
100.0/ 100
METRIC RATING
53rd/ 347
METRIC RANK
17.7%
3 OR MORE VEHICLES IN HOUSEHOLD
0.8/ 100
METRIC RATING
266th/ 347
METRIC RANK
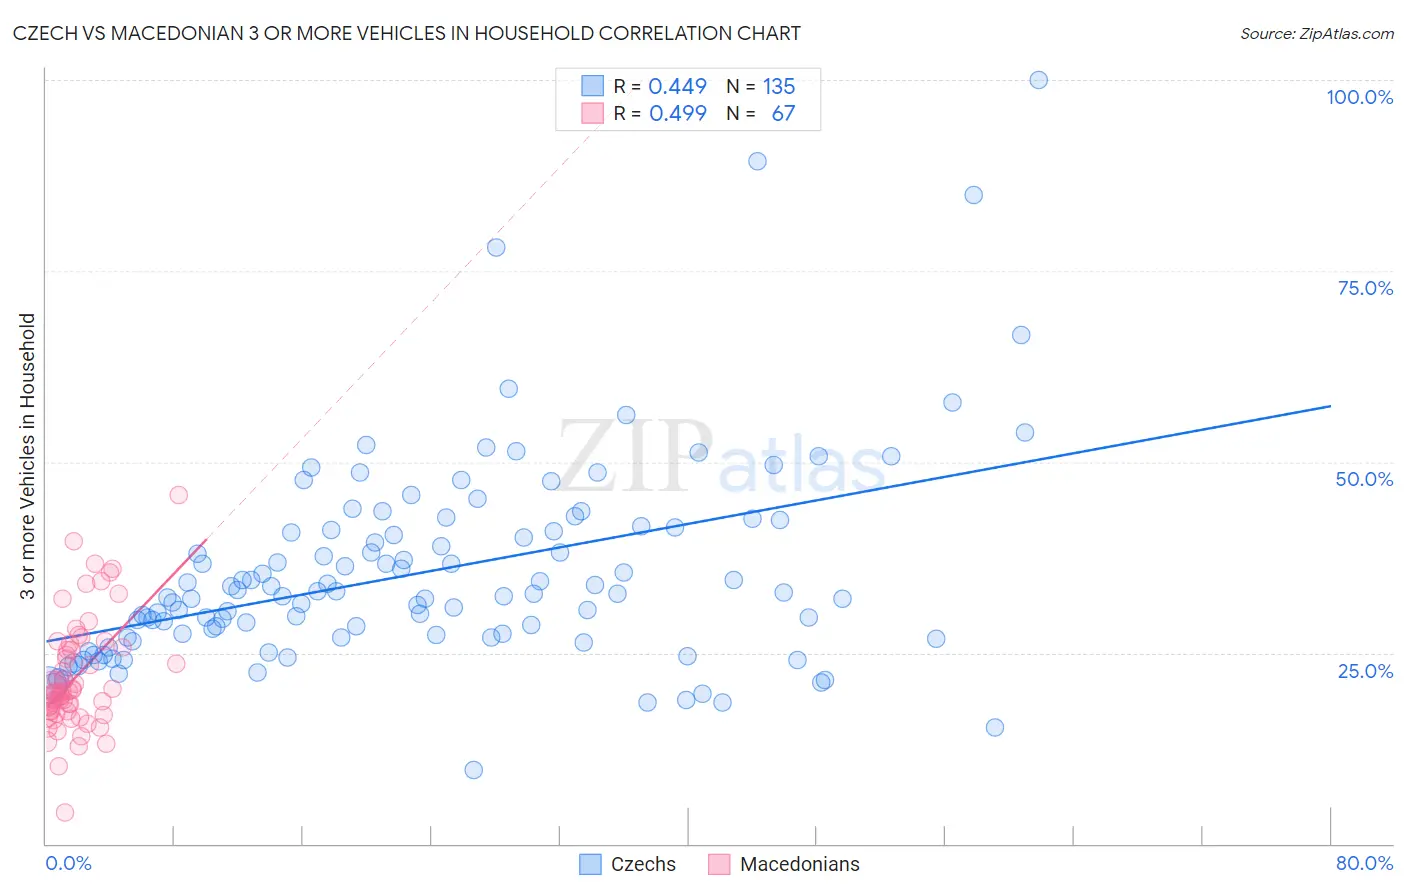
Czech vs Macedonian 3 or more Vehicles in Household Correlation Chart
The statistical analysis conducted on geographies consisting of 484,303,845 people shows a moderate positive correlation between the proportion of Czechs and percentage of households with 3 or more vehicles available in the United States with a correlation coefficient (R) of 0.449 and weighted average of 22.5%. Similarly, the statistical analysis conducted on geographies consisting of 132,563,114 people shows a moderate positive correlation between the proportion of Macedonians and percentage of households with 3 or more vehicles available in the United States with a correlation coefficient (R) of 0.499 and weighted average of 17.7%, a difference of 27.0%.
3 or more Vehicles in Household Correlation Summary
| Measurement | Czech | Macedonian |
| Minimum | 9.6% | 4.0% |
| Maximum | 100.0% | 45.7% |
| Range | 90.4% | 41.6% |
| Mean | 35.5% | 21.8% |
| Median | 32.7% | 19.9% |
| Interquartile 25% (IQ1) | 27.0% | 17.3% |
| Interquartile 75% (IQ3) | 41.0% | 25.7% |
| Interquartile Range (IQR) | 14.0% | 8.4% |
| Standard Deviation (Sample) | 13.6% | 7.4% |
| Standard Deviation (Population) | 13.6% | 7.3% |
Similar Demographics by 3 or more Vehicles in Household
Demographics Similar to Czechs by 3 or more Vehicles in Household
In terms of 3 or more vehicles in household, the demographic groups most similar to Czechs are Crow (22.5%, a difference of 0.21%), Welsh (22.6%, a difference of 0.25%), White/Caucasian (22.6%, a difference of 0.29%), Sioux (22.6%, a difference of 0.30%), and Scotch-Irish (22.6%, a difference of 0.36%).
| Demographics | Rating | Rank | 3 or more Vehicles in Household |
| Americans | 100.0 /100 | #46 | Exceptional 22.6% |
| Malaysians | 100.0 /100 | #47 | Exceptional 22.6% |
| Scottish | 100.0 /100 | #48 | Exceptional 22.6% |
| Scotch-Irish | 100.0 /100 | #49 | Exceptional 22.6% |
| Sioux | 100.0 /100 | #50 | Exceptional 22.6% |
| Whites/Caucasians | 100.0 /100 | #51 | Exceptional 22.6% |
| Welsh | 100.0 /100 | #52 | Exceptional 22.6% |
| Czechs | 100.0 /100 | #53 | Exceptional 22.5% |
| Crow | 100.0 /100 | #54 | Exceptional 22.5% |
| Immigrants | Laos | 100.0 /100 | #55 | Exceptional 22.4% |
| Hispanics or Latinos | 100.0 /100 | #56 | Exceptional 22.4% |
| Pennsylvania Germans | 100.0 /100 | #57 | Exceptional 22.3% |
| Spaniards | 100.0 /100 | #58 | Exceptional 22.3% |
| Navajo | 100.0 /100 | #59 | Exceptional 22.3% |
| Finns | 99.9 /100 | #60 | Exceptional 22.3% |
Demographics Similar to Macedonians by 3 or more Vehicles in Household
In terms of 3 or more vehicles in household, the demographic groups most similar to Macedonians are Immigrants from Panama (17.7%, a difference of 0.020%), Immigrants from Venezuela (17.7%, a difference of 0.050%), Immigrants from Bulgaria (17.7%, a difference of 0.070%), Cambodian (17.8%, a difference of 0.16%), and Bermudan (17.8%, a difference of 0.19%).
| Demographics | Rating | Rank | 3 or more Vehicles in Household |
| Uruguayans | 1.0 /100 | #259 | Tragic 17.8% |
| Ugandans | 0.9 /100 | #260 | Tragic 17.8% |
| Immigrants | Northern Africa | 0.9 /100 | #261 | Tragic 17.8% |
| Colombians | 0.9 /100 | #262 | Tragic 17.8% |
| Bermudans | 0.9 /100 | #263 | Tragic 17.8% |
| Cambodians | 0.9 /100 | #264 | Tragic 17.8% |
| Immigrants | Panama | 0.8 /100 | #265 | Tragic 17.7% |
| Macedonians | 0.8 /100 | #266 | Tragic 17.7% |
| Immigrants | Venezuela | 0.8 /100 | #267 | Tragic 17.7% |
| Immigrants | Bulgaria | 0.8 /100 | #268 | Tragic 17.7% |
| Immigrants | France | 0.6 /100 | #269 | Tragic 17.6% |
| Immigrants | Nepal | 0.6 /100 | #270 | Tragic 17.6% |
| South Americans | 0.6 /100 | #271 | Tragic 17.6% |
| Immigrants | Africa | 0.5 /100 | #272 | Tragic 17.6% |
| Immigrants | Sudan | 0.5 /100 | #273 | Tragic 17.6% |