Honduran vs Macedonian College, 1 year or more
COMPARE
Honduran
Macedonian
College, 1 year or more
College, 1 year or more Comparison
Hondurans
Macedonians
51.6%
COLLEGE, 1 YEAR OR MORE
0.0/ 100
METRIC RATING
310th/ 347
METRIC RANK
61.8%
COLLEGE, 1 YEAR OR MORE
95.6/ 100
METRIC RATING
111th/ 347
METRIC RANK
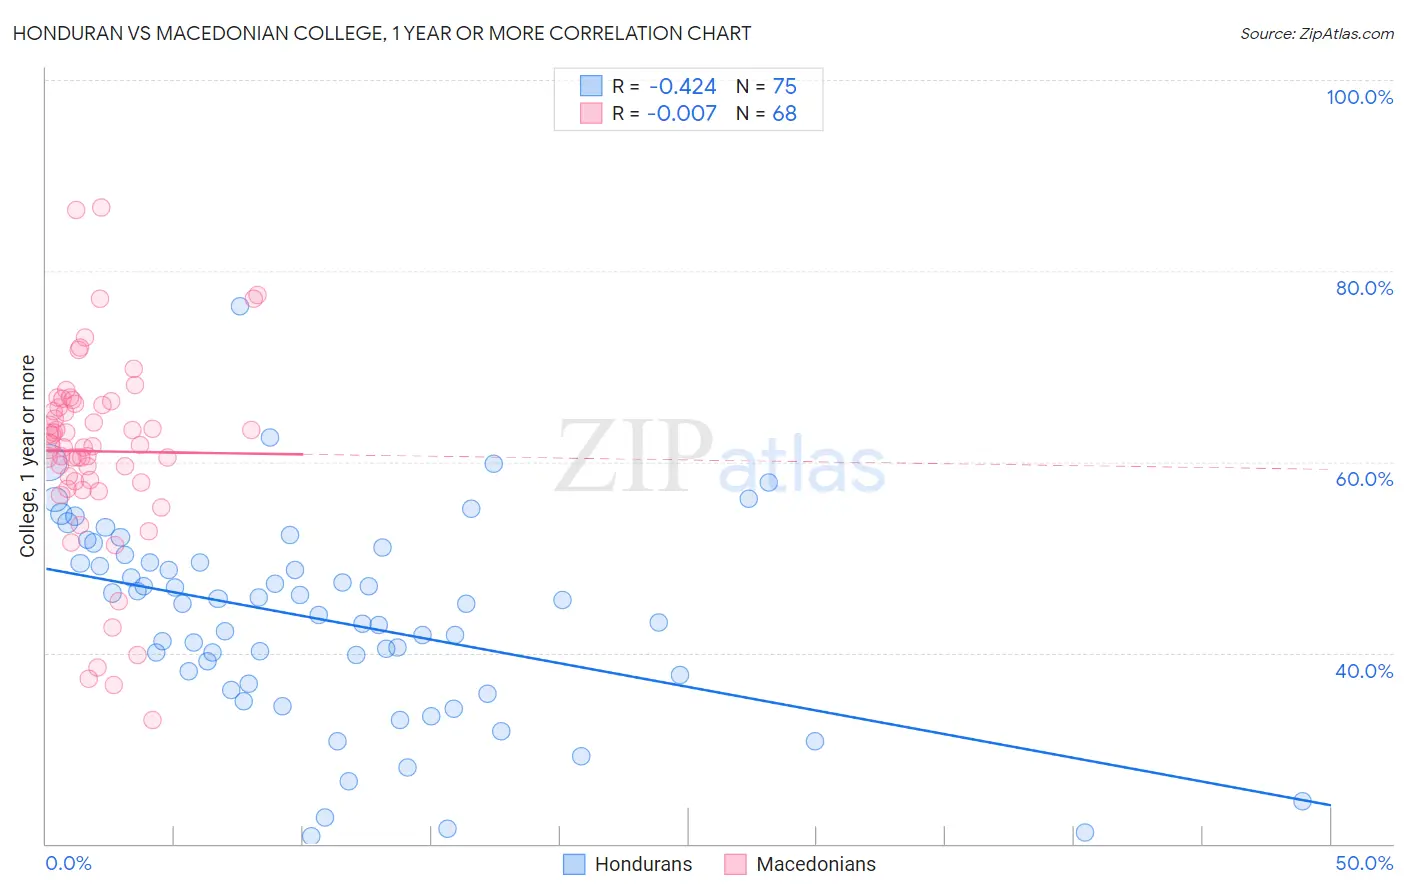
Honduran vs Macedonian College, 1 year or more Correlation Chart
The statistical analysis conducted on geographies consisting of 357,855,848 people shows a moderate negative correlation between the proportion of Hondurans and percentage of population with at least college, 1 year or more education in the United States with a correlation coefficient (R) of -0.424 and weighted average of 51.6%. Similarly, the statistical analysis conducted on geographies consisting of 132,646,607 people shows no correlation between the proportion of Macedonians and percentage of population with at least college, 1 year or more education in the United States with a correlation coefficient (R) of -0.007 and weighted average of 61.8%, a difference of 19.9%.
College, 1 year or more Correlation Summary
| Measurement | Honduran | Macedonian |
| Minimum | 20.7% | 33.0% |
| Maximum | 76.3% | 86.6% |
| Range | 55.6% | 53.6% |
| Mean | 43.4% | 61.1% |
| Median | 45.1% | 61.7% |
| Interquartile 25% (IQ1) | 36.7% | 57.9% |
| Interquartile 75% (IQ3) | 49.5% | 66.0% |
| Interquartile Range (IQR) | 12.8% | 8.1% |
| Standard Deviation (Sample) | 10.4% | 10.1% |
| Standard Deviation (Population) | 10.4% | 10.1% |
Similar Demographics by College, 1 year or more
Demographics Similar to Hondurans by College, 1 year or more
In terms of college, 1 year or more, the demographic groups most similar to Hondurans are Immigrants from Haiti (51.5%, a difference of 0.16%), Pueblo (51.5%, a difference of 0.20%), Immigrants from Caribbean (51.4%, a difference of 0.33%), Apache (51.8%, a difference of 0.39%), and Salvadoran (51.8%, a difference of 0.40%).
| Demographics | Rating | Rank | College, 1 year or more |
| Creek | 0.0 /100 | #303 | Tragic 52.2% |
| Central Americans | 0.0 /100 | #304 | Tragic 52.1% |
| Seminole | 0.0 /100 | #305 | Tragic 52.1% |
| Mexican American Indians | 0.0 /100 | #306 | Tragic 51.9% |
| Immigrants | Portugal | 0.0 /100 | #307 | Tragic 51.9% |
| Salvadorans | 0.0 /100 | #308 | Tragic 51.8% |
| Apache | 0.0 /100 | #309 | Tragic 51.8% |
| Hondurans | 0.0 /100 | #310 | Tragic 51.6% |
| Immigrants | Haiti | 0.0 /100 | #311 | Tragic 51.5% |
| Pueblo | 0.0 /100 | #312 | Tragic 51.5% |
| Immigrants | Caribbean | 0.0 /100 | #313 | Tragic 51.4% |
| Fijians | 0.0 /100 | #314 | Tragic 51.3% |
| Guatemalans | 0.0 /100 | #315 | Tragic 51.2% |
| Cajuns | 0.0 /100 | #316 | Tragic 51.2% |
| Hispanics or Latinos | 0.0 /100 | #317 | Tragic 51.1% |
Demographics Similar to Macedonians by College, 1 year or more
In terms of college, 1 year or more, the demographic groups most similar to Macedonians are European (61.8%, a difference of 0.0%), Syrian (61.9%, a difference of 0.020%), Immigrants from Northern Africa (61.9%, a difference of 0.020%), Immigrants from Ukraine (61.9%, a difference of 0.040%), and Austrian (61.8%, a difference of 0.060%).
| Demographics | Rating | Rank | College, 1 year or more |
| Chileans | 96.4 /100 | #104 | Exceptional 62.0% |
| Immigrants | Nepal | 96.3 /100 | #105 | Exceptional 62.0% |
| Palestinians | 96.3 /100 | #106 | Exceptional 62.0% |
| Immigrants | Ukraine | 95.8 /100 | #107 | Exceptional 61.9% |
| Syrians | 95.7 /100 | #108 | Exceptional 61.9% |
| Immigrants | Northern Africa | 95.7 /100 | #109 | Exceptional 61.9% |
| Europeans | 95.6 /100 | #110 | Exceptional 61.8% |
| Macedonians | 95.6 /100 | #111 | Exceptional 61.8% |
| Austrians | 95.4 /100 | #112 | Exceptional 61.8% |
| Ukrainians | 95.2 /100 | #113 | Exceptional 61.8% |
| Danes | 94.8 /100 | #114 | Exceptional 61.7% |
| Norwegians | 94.5 /100 | #115 | Exceptional 61.7% |
| Lebanese | 94.1 /100 | #116 | Exceptional 61.6% |
| Arabs | 93.9 /100 | #117 | Exceptional 61.6% |
| Immigrants | Brazil | 93.9 /100 | #118 | Exceptional 61.6% |