Hmong vs Immigrants from Senegal Unemployment
COMPARE
Hmong
Immigrants from Senegal
Unemployment
Unemployment Comparison
Hmong
Immigrants from Senegal
5.0%
UNEMPLOYMENT
97.6/ 100
METRIC RATING
83rd/ 347
METRIC RANK
6.1%
UNEMPLOYMENT
0.0/ 100
METRIC RATING
285th/ 347
METRIC RANK
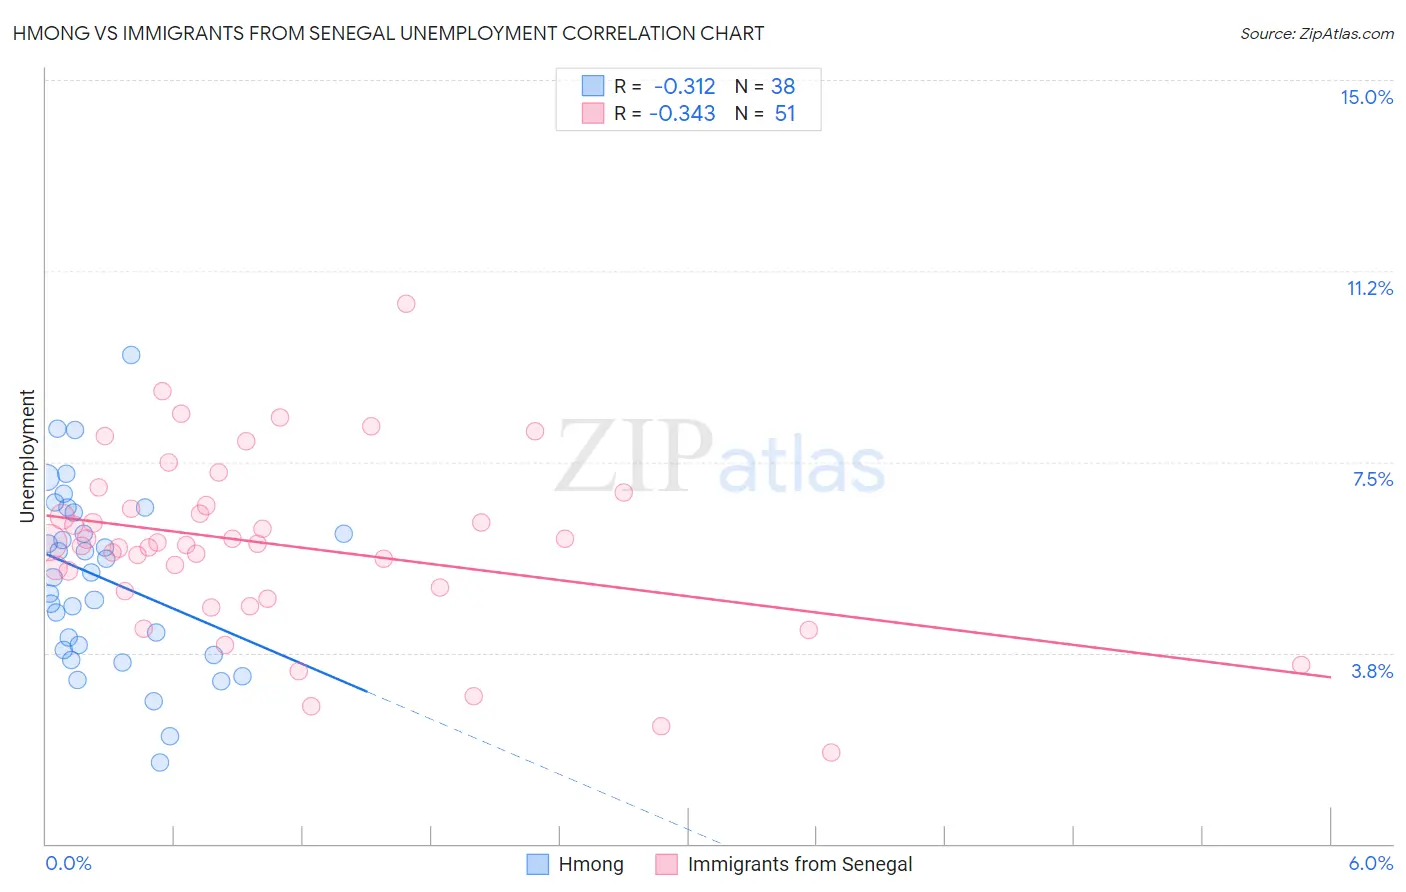
Hmong vs Immigrants from Senegal Unemployment Correlation Chart
The statistical analysis conducted on geographies consisting of 24,672,093 people shows a mild negative correlation between the proportion of Hmong and unemployment in the United States with a correlation coefficient (R) of -0.312 and weighted average of 5.0%. Similarly, the statistical analysis conducted on geographies consisting of 90,076,703 people shows a mild negative correlation between the proportion of Immigrants from Senegal and unemployment in the United States with a correlation coefficient (R) of -0.343 and weighted average of 6.1%, a difference of 23.5%.
Unemployment Correlation Summary
| Measurement | Hmong | Immigrants from Senegal |
| Minimum | 1.6% | 1.8% |
| Maximum | 9.6% | 10.6% |
| Range | 8.0% | 8.8% |
| Mean | 5.2% | 5.9% |
| Median | 5.3% | 5.9% |
| Interquartile 25% (IQ1) | 3.8% | 5.0% |
| Interquartile 75% (IQ3) | 6.5% | 6.6% |
| Interquartile Range (IQR) | 2.7% | 1.7% |
| Standard Deviation (Sample) | 1.8% | 1.7% |
| Standard Deviation (Population) | 1.7% | 1.7% |
Similar Demographics by Unemployment
Demographics Similar to Hmong by Unemployment
In terms of unemployment, the demographic groups most similar to Hmong are Fijian (5.0%, a difference of 0.010%), Basque (5.0%, a difference of 0.020%), Immigrants from Sweden (5.0%, a difference of 0.030%), Russian (5.0%, a difference of 0.080%), and Canadian (5.0%, a difference of 0.10%).
| Demographics | Rating | Rank | Unemployment |
| German Russians | 98.0 /100 | #76 | Exceptional 4.9% |
| Cypriots | 97.9 /100 | #77 | Exceptional 4.9% |
| Okinawans | 97.9 /100 | #78 | Exceptional 4.9% |
| Canadians | 97.7 /100 | #79 | Exceptional 5.0% |
| Immigrants | Sweden | 97.6 /100 | #80 | Exceptional 5.0% |
| Basques | 97.6 /100 | #81 | Exceptional 5.0% |
| Fijians | 97.6 /100 | #82 | Exceptional 5.0% |
| Hmong | 97.6 /100 | #83 | Exceptional 5.0% |
| Russians | 97.4 /100 | #84 | Exceptional 5.0% |
| Immigrants | Australia | 97.0 /100 | #85 | Exceptional 5.0% |
| Hungarians | 96.9 /100 | #86 | Exceptional 5.0% |
| Immigrants | Moldova | 96.6 /100 | #87 | Exceptional 5.0% |
| Immigrants | Korea | 96.6 /100 | #88 | Exceptional 5.0% |
| Jordanians | 96.4 /100 | #89 | Exceptional 5.0% |
| Immigrants | North Macedonia | 96.3 /100 | #90 | Exceptional 5.0% |
Demographics Similar to Immigrants from Senegal by Unemployment
In terms of unemployment, the demographic groups most similar to Immigrants from Senegal are Immigrants from Caribbean (6.2%, a difference of 0.43%), Nepalese (6.2%, a difference of 0.76%), Ecuadorian (6.2%, a difference of 0.79%), Aleut (6.1%, a difference of 0.93%), and Immigrants from Ghana (6.1%, a difference of 1.1%).
| Demographics | Rating | Rank | Unemployment |
| Ghanaians | 0.0 /100 | #278 | Tragic 6.0% |
| Immigrants | Mexico | 0.0 /100 | #279 | Tragic 6.0% |
| Immigrants | Western Africa | 0.0 /100 | #280 | Tragic 6.0% |
| Africans | 0.0 /100 | #281 | Tragic 6.1% |
| Immigrants | Azores | 0.0 /100 | #282 | Tragic 6.1% |
| Immigrants | Ghana | 0.0 /100 | #283 | Tragic 6.1% |
| Aleuts | 0.0 /100 | #284 | Tragic 6.1% |
| Immigrants | Senegal | 0.0 /100 | #285 | Tragic 6.1% |
| Immigrants | Caribbean | 0.0 /100 | #286 | Tragic 6.2% |
| Nepalese | 0.0 /100 | #287 | Tragic 6.2% |
| Ecuadorians | 0.0 /100 | #288 | Tragic 6.2% |
| Chippewa | 0.0 /100 | #289 | Tragic 6.2% |
| Senegalese | 0.0 /100 | #290 | Tragic 6.2% |
| Haitians | 0.0 /100 | #291 | Tragic 6.2% |
| Central American Indians | 0.0 /100 | #292 | Tragic 6.2% |