Immigrants from Western Asia vs Vietnamese 2 or more Vehicles in Household
COMPARE
Immigrants from Western Asia
Vietnamese
2 or more Vehicles in Household
2 or more Vehicles in Household Comparison
Immigrants from Western Asia
Vietnamese
54.1%
2 OR MORE VEHICLES IN HOUSEHOLD
9.3/ 100
METRIC RATING
216th/ 347
METRIC RANK
38.5%
2 OR MORE VEHICLES IN HOUSEHOLD
0.0/ 100
METRIC RATING
336th/ 347
METRIC RANK
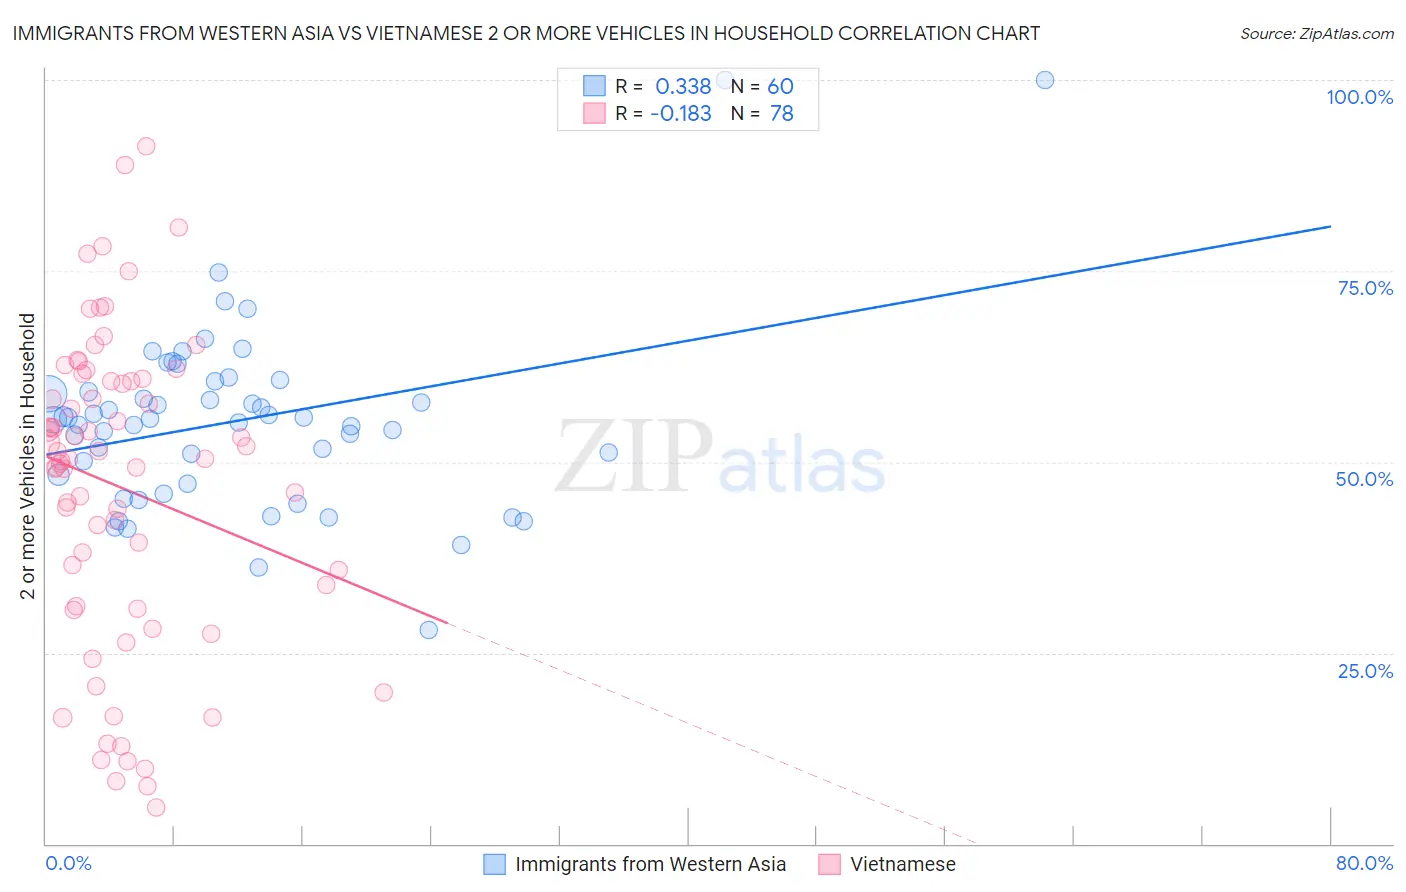
Immigrants from Western Asia vs Vietnamese 2 or more Vehicles in Household Correlation Chart
The statistical analysis conducted on geographies consisting of 404,211,339 people shows a mild positive correlation between the proportion of Immigrants from Western Asia and percentage of households with 2 or more vehicles available in the United States with a correlation coefficient (R) of 0.338 and weighted average of 54.1%. Similarly, the statistical analysis conducted on geographies consisting of 170,680,365 people shows a poor negative correlation between the proportion of Vietnamese and percentage of households with 2 or more vehicles available in the United States with a correlation coefficient (R) of -0.183 and weighted average of 38.5%, a difference of 40.5%.
2 or more Vehicles in Household Correlation Summary
| Measurement | Immigrants from Western Asia | Vietnamese |
| Minimum | 28.0% | 4.7% |
| Maximum | 100.0% | 91.3% |
| Range | 72.0% | 86.6% |
| Mean | 55.4% | 46.7% |
| Median | 55.6% | 50.4% |
| Interquartile 25% (IQ1) | 47.7% | 31.1% |
| Interquartile 75% (IQ3) | 59.9% | 60.6% |
| Interquartile Range (IQR) | 12.2% | 29.5% |
| Standard Deviation (Sample) | 12.2% | 20.3% |
| Standard Deviation (Population) | 12.1% | 20.2% |
Similar Demographics by 2 or more Vehicles in Household
Demographics Similar to Immigrants from Western Asia by 2 or more Vehicles in Household
In terms of 2 or more vehicles in household, the demographic groups most similar to Immigrants from Western Asia are Aleut (54.1%, a difference of 0.0%), Immigrants from Czechoslovakia (54.1%, a difference of 0.020%), Guatemalan (54.1%, a difference of 0.040%), Immigrants from Chile (54.2%, a difference of 0.20%), and Immigrants from Hungary (54.2%, a difference of 0.22%).
| Demographics | Rating | Rank | 2 or more Vehicles in Household |
| Immigrants | Bulgaria | 12.0 /100 | #209 | Poor 54.3% |
| Immigrants | Saudi Arabia | 11.3 /100 | #210 | Poor 54.2% |
| Immigrants | Hungary | 11.3 /100 | #211 | Poor 54.2% |
| Immigrants | Chile | 11.1 /100 | #212 | Poor 54.2% |
| Guatemalans | 9.6 /100 | #213 | Tragic 54.1% |
| Immigrants | Czechoslovakia | 9.4 /100 | #214 | Tragic 54.1% |
| Aleuts | 9.3 /100 | #215 | Tragic 54.1% |
| Immigrants | Western Asia | 9.3 /100 | #216 | Tragic 54.1% |
| Immigrants | Burma/Myanmar | 7.1 /100 | #217 | Tragic 53.9% |
| Immigrants | Argentina | 6.8 /100 | #218 | Tragic 53.9% |
| South American Indians | 6.5 /100 | #219 | Tragic 53.9% |
| Taiwanese | 6.3 /100 | #220 | Tragic 53.9% |
| Immigrants | Singapore | 6.3 /100 | #221 | Tragic 53.9% |
| Kiowa | 6.2 /100 | #222 | Tragic 53.9% |
| Immigrants | Bosnia and Herzegovina | 5.5 /100 | #223 | Tragic 53.8% |
Demographics Similar to Vietnamese by 2 or more Vehicles in Household
In terms of 2 or more vehicles in household, the demographic groups most similar to Vietnamese are Barbadian (38.3%, a difference of 0.41%), Immigrants from Bangladesh (38.8%, a difference of 0.72%), Immigrants from Uzbekistan (37.9%, a difference of 1.6%), Immigrants from Trinidad and Tobago (40.3%, a difference of 4.6%), and Immigrants from Ecuador (40.5%, a difference of 5.2%).
| Demographics | Rating | Rank | 2 or more Vehicles in Household |
| Ecuadorians | 0.0 /100 | #329 | Tragic 42.0% |
| Immigrants | Dominica | 0.0 /100 | #330 | Tragic 41.6% |
| West Indians | 0.0 /100 | #331 | Tragic 41.3% |
| Trinidadians and Tobagonians | 0.0 /100 | #332 | Tragic 40.9% |
| Immigrants | Ecuador | 0.0 /100 | #333 | Tragic 40.5% |
| Immigrants | Trinidad and Tobago | 0.0 /100 | #334 | Tragic 40.3% |
| Immigrants | Bangladesh | 0.0 /100 | #335 | Tragic 38.8% |
| Vietnamese | 0.0 /100 | #336 | Tragic 38.5% |
| Barbadians | 0.0 /100 | #337 | Tragic 38.3% |
| Immigrants | Uzbekistan | 0.0 /100 | #338 | Tragic 37.9% |
| Immigrants | Barbados | 0.0 /100 | #339 | Tragic 35.8% |
| British West Indians | 0.0 /100 | #340 | Tragic 35.4% |
| Guyanese | 0.0 /100 | #341 | Tragic 35.4% |
| Dominicans | 0.0 /100 | #342 | Tragic 35.3% |
| Immigrants | Guyana | 0.0 /100 | #343 | Tragic 35.0% |