Lebanese vs Vietnamese 2 or more Vehicles in Household
COMPARE
Lebanese
Vietnamese
2 or more Vehicles in Household
2 or more Vehicles in Household Comparison
Lebanese
Vietnamese
57.6%
2 OR MORE VEHICLES IN HOUSEHOLD
98.3/ 100
METRIC RATING
101st/ 347
METRIC RANK
38.5%
2 OR MORE VEHICLES IN HOUSEHOLD
0.0/ 100
METRIC RATING
336th/ 347
METRIC RANK
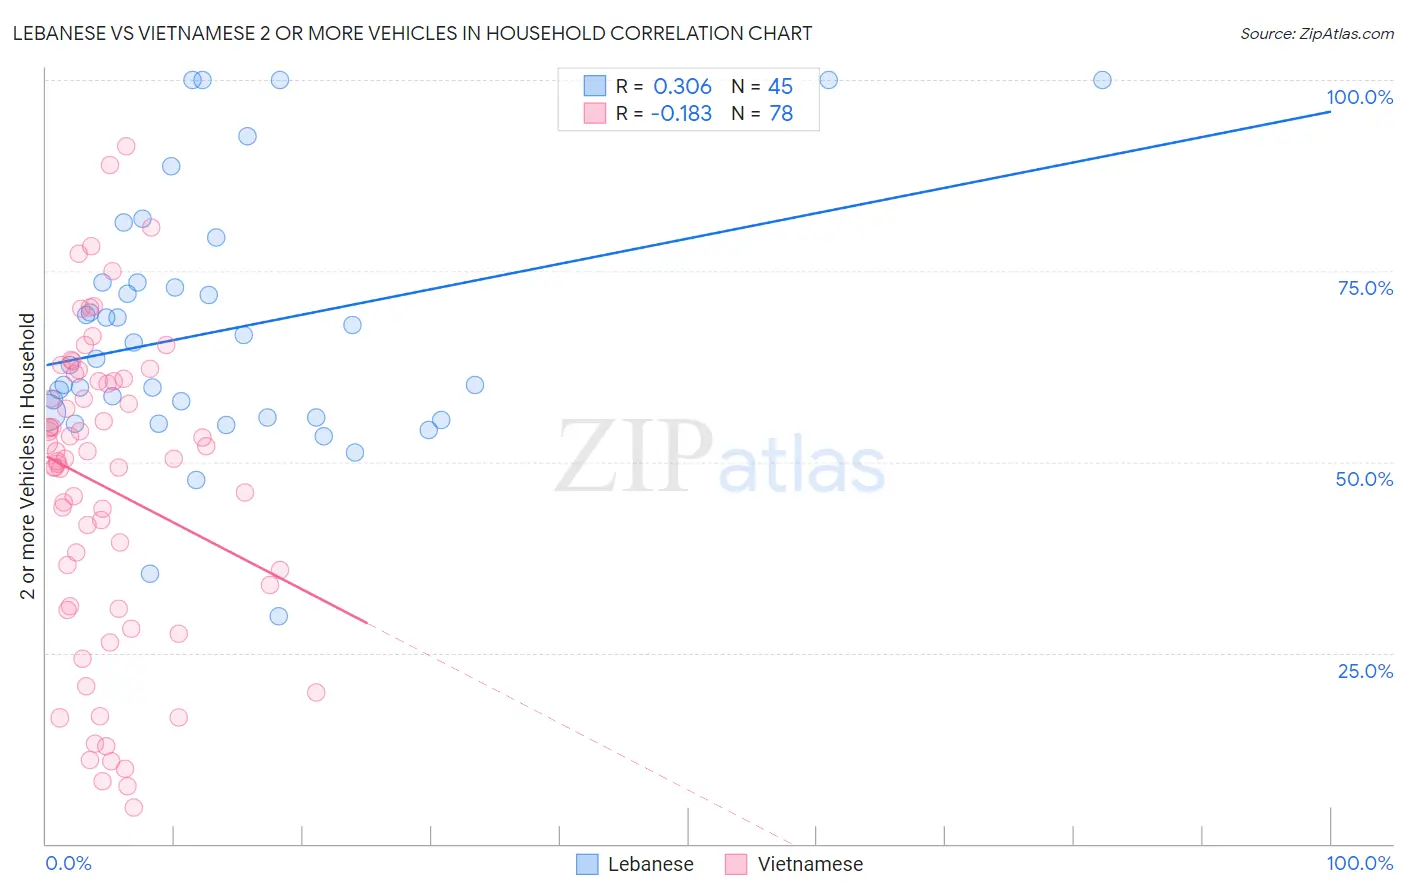
Lebanese vs Vietnamese 2 or more Vehicles in Household Correlation Chart
The statistical analysis conducted on geographies consisting of 401,369,606 people shows a mild positive correlation between the proportion of Lebanese and percentage of households with 2 or more vehicles available in the United States with a correlation coefficient (R) of 0.306 and weighted average of 57.6%. Similarly, the statistical analysis conducted on geographies consisting of 170,680,365 people shows a poor negative correlation between the proportion of Vietnamese and percentage of households with 2 or more vehicles available in the United States with a correlation coefficient (R) of -0.183 and weighted average of 38.5%, a difference of 49.6%.
2 or more Vehicles in Household Correlation Summary
| Measurement | Lebanese | Vietnamese |
| Minimum | 29.8% | 4.7% |
| Maximum | 100.0% | 91.3% |
| Range | 70.2% | 86.6% |
| Mean | 67.2% | 46.7% |
| Median | 63.5% | 50.4% |
| Interquartile 25% (IQ1) | 55.8% | 31.1% |
| Interquartile 75% (IQ3) | 73.5% | 60.6% |
| Interquartile Range (IQR) | 17.8% | 29.5% |
| Standard Deviation (Sample) | 16.6% | 20.3% |
| Standard Deviation (Population) | 16.4% | 20.2% |
Similar Demographics by 2 or more Vehicles in Household
Demographics Similar to Lebanese by 2 or more Vehicles in Household
In terms of 2 or more vehicles in household, the demographic groups most similar to Lebanese are Fijian (57.6%, a difference of 0.050%), Immigrants from Bolivia (57.6%, a difference of 0.050%), Jordanian (57.6%, a difference of 0.050%), Immigrants from Indonesia (57.6%, a difference of 0.050%), and Immigrants from Korea (57.6%, a difference of 0.050%).
| Demographics | Rating | Rank | 2 or more Vehicles in Household |
| Filipinos | 98.9 /100 | #94 | Exceptional 57.8% |
| Hmong | 98.9 /100 | #95 | Exceptional 57.8% |
| Burmese | 98.8 /100 | #96 | Exceptional 57.8% |
| Slavs | 98.8 /100 | #97 | Exceptional 57.8% |
| Palestinians | 98.6 /100 | #98 | Exceptional 57.7% |
| Cajuns | 98.5 /100 | #99 | Exceptional 57.7% |
| Fijians | 98.4 /100 | #100 | Exceptional 57.6% |
| Lebanese | 98.3 /100 | #101 | Exceptional 57.6% |
| Immigrants | Bolivia | 98.2 /100 | #102 | Exceptional 57.6% |
| Jordanians | 98.2 /100 | #103 | Exceptional 57.6% |
| Immigrants | Indonesia | 98.2 /100 | #104 | Exceptional 57.6% |
| Immigrants | Korea | 98.2 /100 | #105 | Exceptional 57.6% |
| Immigrants | Oceania | 98.2 /100 | #106 | Exceptional 57.5% |
| Immigrants | Netherlands | 98.2 /100 | #107 | Exceptional 57.5% |
| Immigrants | Canada | 98.1 /100 | #108 | Exceptional 57.5% |
Demographics Similar to Vietnamese by 2 or more Vehicles in Household
In terms of 2 or more vehicles in household, the demographic groups most similar to Vietnamese are Barbadian (38.3%, a difference of 0.41%), Immigrants from Bangladesh (38.8%, a difference of 0.72%), Immigrants from Uzbekistan (37.9%, a difference of 1.6%), Immigrants from Trinidad and Tobago (40.3%, a difference of 4.6%), and Immigrants from Ecuador (40.5%, a difference of 5.2%).
| Demographics | Rating | Rank | 2 or more Vehicles in Household |
| Ecuadorians | 0.0 /100 | #329 | Tragic 42.0% |
| Immigrants | Dominica | 0.0 /100 | #330 | Tragic 41.6% |
| West Indians | 0.0 /100 | #331 | Tragic 41.3% |
| Trinidadians and Tobagonians | 0.0 /100 | #332 | Tragic 40.9% |
| Immigrants | Ecuador | 0.0 /100 | #333 | Tragic 40.5% |
| Immigrants | Trinidad and Tobago | 0.0 /100 | #334 | Tragic 40.3% |
| Immigrants | Bangladesh | 0.0 /100 | #335 | Tragic 38.8% |
| Vietnamese | 0.0 /100 | #336 | Tragic 38.5% |
| Barbadians | 0.0 /100 | #337 | Tragic 38.3% |
| Immigrants | Uzbekistan | 0.0 /100 | #338 | Tragic 37.9% |
| Immigrants | Barbados | 0.0 /100 | #339 | Tragic 35.8% |
| British West Indians | 0.0 /100 | #340 | Tragic 35.4% |
| Guyanese | 0.0 /100 | #341 | Tragic 35.4% |
| Dominicans | 0.0 /100 | #342 | Tragic 35.3% |
| Immigrants | Guyana | 0.0 /100 | #343 | Tragic 35.0% |