Guatemalan vs Ute Median Female Earnings
COMPARE
Guatemalan
Ute
Median Female Earnings
Median Female Earnings Comparison
Guatemalans
Ute
$35,695
MEDIAN FEMALE EARNINGS
0.0/ 100
METRIC RATING
293rd/ 347
METRIC RANK
$34,960
MEDIAN FEMALE EARNINGS
0.0/ 100
METRIC RATING
311th/ 347
METRIC RANK
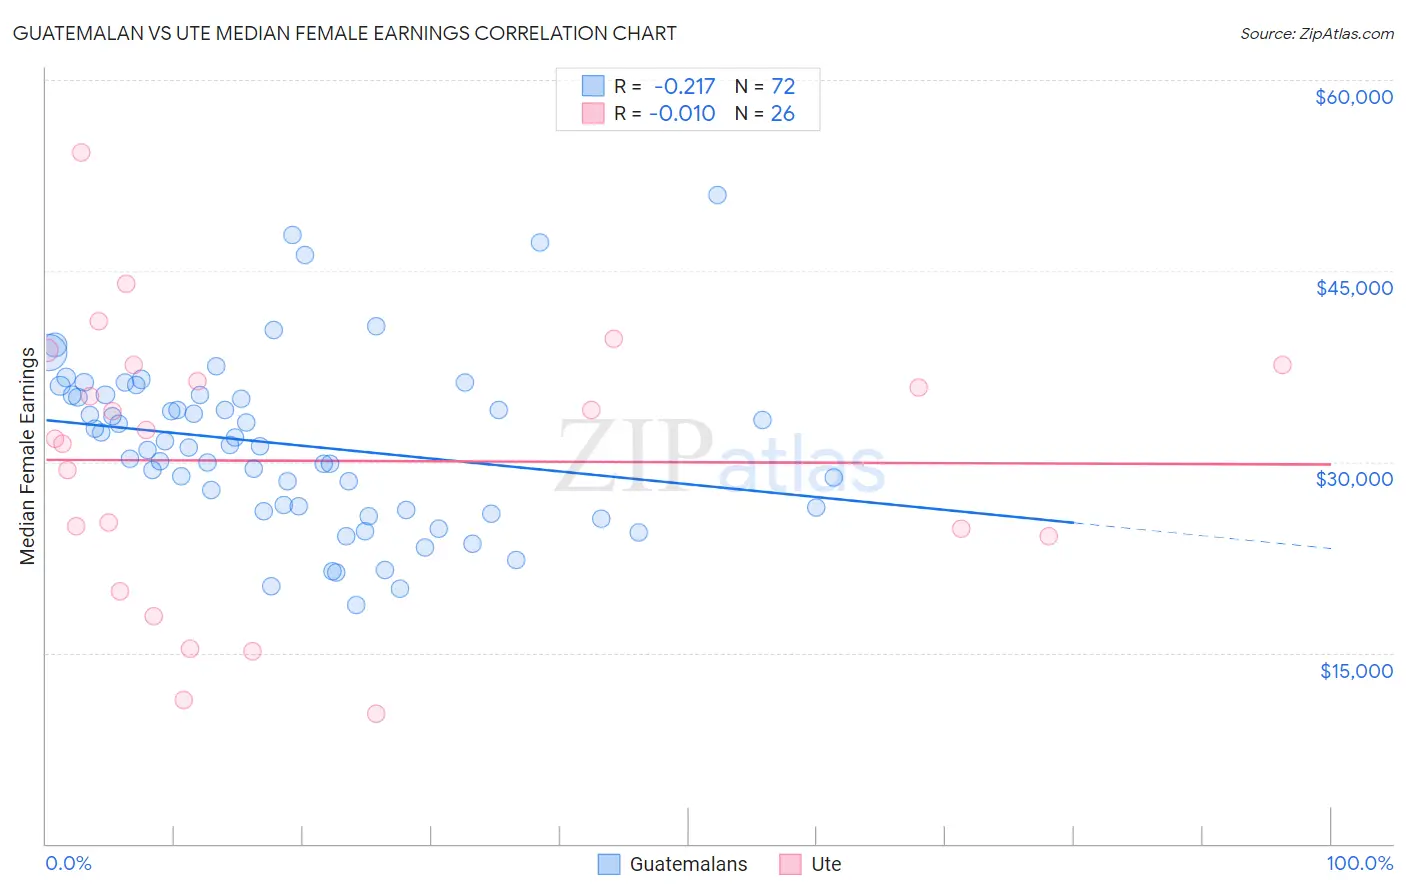
Guatemalan vs Ute Median Female Earnings Correlation Chart
The statistical analysis conducted on geographies consisting of 409,414,975 people shows a weak negative correlation between the proportion of Guatemalans and median female earnings in the United States with a correlation coefficient (R) of -0.217 and weighted average of $35,695. Similarly, the statistical analysis conducted on geographies consisting of 55,659,535 people shows no correlation between the proportion of Ute and median female earnings in the United States with a correlation coefficient (R) of -0.010 and weighted average of $34,960, a difference of 2.1%.
Median Female Earnings Correlation Summary
| Measurement | Guatemalan | Ute |
| Minimum | $18,750 | $10,250 |
| Maximum | $50,917 | $54,350 |
| Range | $32,167 | $44,100 |
| Mean | $31,367 | $30,088 |
| Median | $31,263 | $32,195 |
| Interquartile 25% (IQ1) | $26,284 | $24,148 |
| Interquartile 75% (IQ3) | $35,245 | $37,604 |
| Interquartile Range (IQR) | $8,961 | $13,456 |
| Standard Deviation (Sample) | $6,641 | $10,734 |
| Standard Deviation (Population) | $6,594 | $10,525 |
Demographics Similar to Guatemalans and Ute by Median Female Earnings
In terms of median female earnings, the demographic groups most similar to Guatemalans are Cheyenne ($35,673, a difference of 0.060%), Comanche ($35,661, a difference of 0.090%), Mexican American Indian ($35,629, a difference of 0.19%), American ($35,777, a difference of 0.23%), and Hmong ($35,498, a difference of 0.56%). Similarly, the demographic groups most similar to Ute are Yaqui ($34,943, a difference of 0.050%), Chippewa ($35,003, a difference of 0.12%), Honduran ($35,013, a difference of 0.15%), Immigrants from Bahamas ($35,027, a difference of 0.19%), and Sioux ($35,063, a difference of 0.29%).
| Demographics | Rating | Rank | Median Female Earnings |
| Americans | 0.0 /100 | #292 | Tragic $35,777 |
| Guatemalans | 0.0 /100 | #293 | Tragic $35,695 |
| Cheyenne | 0.0 /100 | #294 | Tragic $35,673 |
| Comanche | 0.0 /100 | #295 | Tragic $35,661 |
| Mexican American Indians | 0.0 /100 | #296 | Tragic $35,629 |
| Hmong | 0.0 /100 | #297 | Tragic $35,498 |
| Immigrants | Micronesia | 0.0 /100 | #298 | Tragic $35,477 |
| Immigrants | Guatemala | 0.0 /100 | #299 | Tragic $35,444 |
| Yuman | 0.0 /100 | #300 | Tragic $35,377 |
| Pima | 0.0 /100 | #301 | Tragic $35,326 |
| Blacks/African Americans | 0.0 /100 | #302 | Tragic $35,315 |
| Immigrants | Latin America | 0.0 /100 | #303 | Tragic $35,307 |
| Crow | 0.0 /100 | #304 | Tragic $35,266 |
| Bahamians | 0.0 /100 | #305 | Tragic $35,125 |
| Fijians | 0.0 /100 | #306 | Tragic $35,114 |
| Sioux | 0.0 /100 | #307 | Tragic $35,063 |
| Immigrants | Bahamas | 0.0 /100 | #308 | Tragic $35,027 |
| Hondurans | 0.0 /100 | #309 | Tragic $35,013 |
| Chippewa | 0.0 /100 | #310 | Tragic $35,003 |
| Ute | 0.0 /100 | #311 | Tragic $34,960 |
| Yaqui | 0.0 /100 | #312 | Tragic $34,943 |