Guatemalan vs Bermudan 2 or more Vehicles in Household
COMPARE
Guatemalan
Bermudan
2 or more Vehicles in Household
2 or more Vehicles in Household Comparison
Guatemalans
Bermudans
54.1%
2 OR MORE VEHICLES IN HOUSEHOLD
9.6/ 100
METRIC RATING
213th/ 347
METRIC RANK
50.6%
2 OR MORE VEHICLES IN HOUSEHOLD
0.0/ 100
METRIC RATING
294th/ 347
METRIC RANK
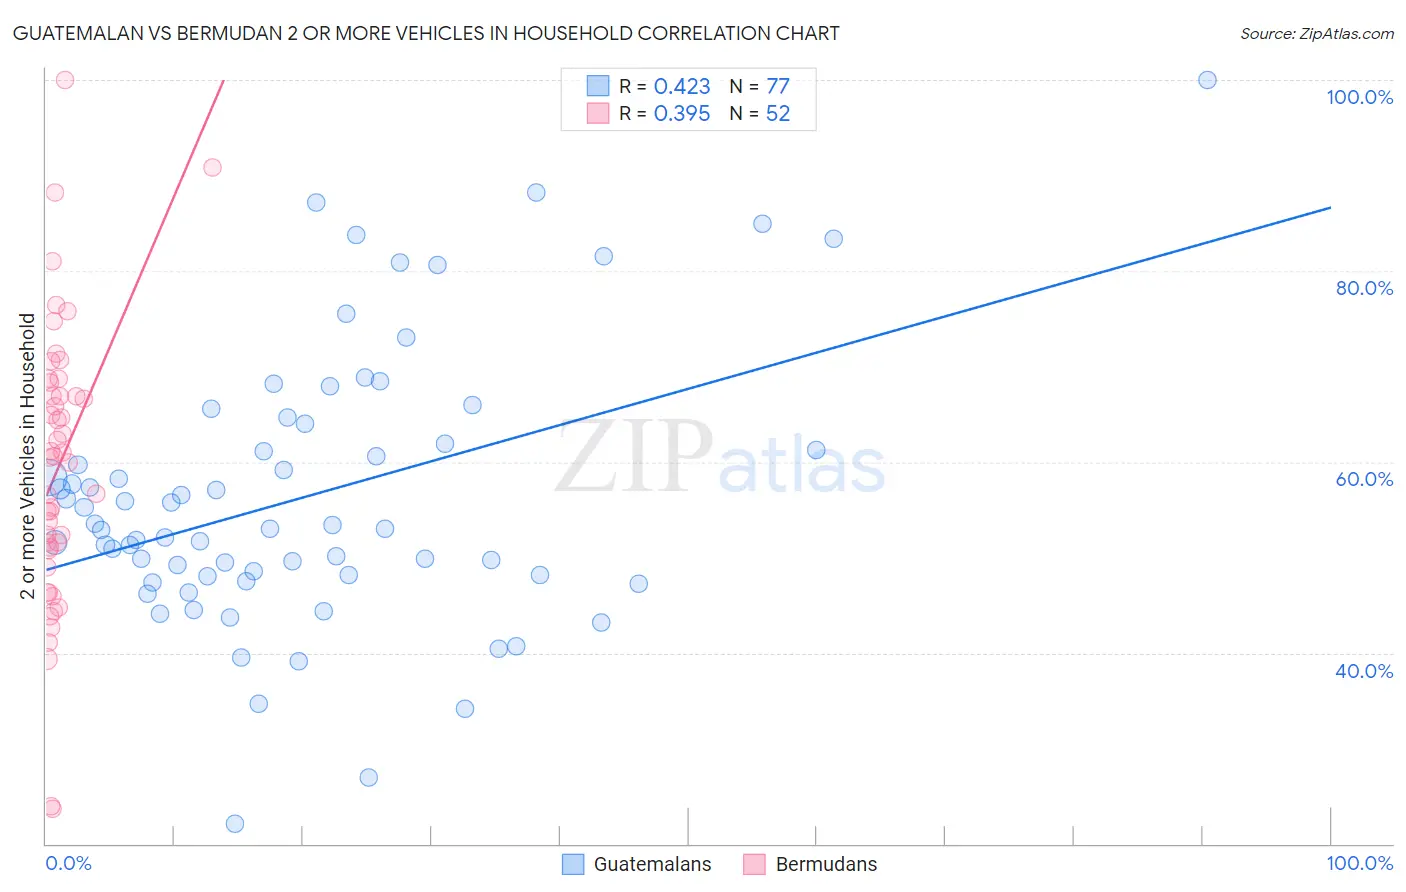
Guatemalan vs Bermudan 2 or more Vehicles in Household Correlation Chart
The statistical analysis conducted on geographies consisting of 409,337,767 people shows a moderate positive correlation between the proportion of Guatemalans and percentage of households with 2 or more vehicles available in the United States with a correlation coefficient (R) of 0.423 and weighted average of 54.1%. Similarly, the statistical analysis conducted on geographies consisting of 55,716,623 people shows a mild positive correlation between the proportion of Bermudans and percentage of households with 2 or more vehicles available in the United States with a correlation coefficient (R) of 0.395 and weighted average of 50.6%, a difference of 7.0%.
2 or more Vehicles in Household Correlation Summary
| Measurement | Guatemalan | Bermudan |
| Minimum | 22.0% | 23.7% |
| Maximum | 100.0% | 100.0% |
| Range | 78.0% | 76.3% |
| Mean | 56.4% | 59.5% |
| Median | 53.1% | 60.5% |
| Interquartile 25% (IQ1) | 48.1% | 50.9% |
| Interquartile 75% (IQ3) | 63.0% | 67.6% |
| Interquartile Range (IQR) | 14.9% | 16.8% |
| Standard Deviation (Sample) | 14.4% | 14.7% |
| Standard Deviation (Population) | 14.3% | 14.6% |
Similar Demographics by 2 or more Vehicles in Household
Demographics Similar to Guatemalans by 2 or more Vehicles in Household
In terms of 2 or more vehicles in household, the demographic groups most similar to Guatemalans are Immigrants from Czechoslovakia (54.1%, a difference of 0.020%), Aleut (54.1%, a difference of 0.030%), Immigrants from Western Asia (54.1%, a difference of 0.040%), Immigrants from Chile (54.2%, a difference of 0.16%), and Immigrants from Saudi Arabia (54.2%, a difference of 0.19%).
| Demographics | Rating | Rank | 2 or more Vehicles in Household |
| Immigrants | Latin America | 13.1 /100 | #206 | Poor 54.3% |
| Turks | 13.0 /100 | #207 | Poor 54.3% |
| Egyptians | 12.0 /100 | #208 | Poor 54.3% |
| Immigrants | Bulgaria | 12.0 /100 | #209 | Poor 54.3% |
| Immigrants | Saudi Arabia | 11.3 /100 | #210 | Poor 54.2% |
| Immigrants | Hungary | 11.3 /100 | #211 | Poor 54.2% |
| Immigrants | Chile | 11.1 /100 | #212 | Poor 54.2% |
| Guatemalans | 9.6 /100 | #213 | Tragic 54.1% |
| Immigrants | Czechoslovakia | 9.4 /100 | #214 | Tragic 54.1% |
| Aleuts | 9.3 /100 | #215 | Tragic 54.1% |
| Immigrants | Western Asia | 9.3 /100 | #216 | Tragic 54.1% |
| Immigrants | Burma/Myanmar | 7.1 /100 | #217 | Tragic 53.9% |
| Immigrants | Argentina | 6.8 /100 | #218 | Tragic 53.9% |
| South American Indians | 6.5 /100 | #219 | Tragic 53.9% |
| Taiwanese | 6.3 /100 | #220 | Tragic 53.9% |
Demographics Similar to Bermudans by 2 or more Vehicles in Household
In terms of 2 or more vehicles in household, the demographic groups most similar to Bermudans are Cypriot (50.6%, a difference of 0.070%), Immigrants from Somalia (50.5%, a difference of 0.11%), Immigrants from Spain (50.4%, a difference of 0.38%), Paraguayan (50.3%, a difference of 0.51%), and Immigrants from Morocco (50.3%, a difference of 0.54%).
| Demographics | Rating | Rank | 2 or more Vehicles in Household |
| Immigrants | Serbia | 0.1 /100 | #287 | Tragic 51.3% |
| Okinawans | 0.1 /100 | #288 | Tragic 51.2% |
| Somalis | 0.0 /100 | #289 | Tragic 51.1% |
| Immigrants | Panama | 0.0 /100 | #290 | Tragic 51.1% |
| Belizeans | 0.0 /100 | #291 | Tragic 51.0% |
| Immigrants | Ukraine | 0.0 /100 | #292 | Tragic 50.9% |
| Blacks/African Americans | 0.0 /100 | #293 | Tragic 50.9% |
| Bermudans | 0.0 /100 | #294 | Tragic 50.6% |
| Cypriots | 0.0 /100 | #295 | Tragic 50.6% |
| Immigrants | Somalia | 0.0 /100 | #296 | Tragic 50.5% |
| Immigrants | Spain | 0.0 /100 | #297 | Tragic 50.4% |
| Paraguayans | 0.0 /100 | #298 | Tragic 50.3% |
| Immigrants | Morocco | 0.0 /100 | #299 | Tragic 50.3% |
| Immigrants | Russia | 0.0 /100 | #300 | Tragic 50.3% |
| Immigrants | Greece | 0.0 /100 | #301 | Tragic 50.2% |