Immigrants from Singapore vs Bermudan 2 or more Vehicles in Household
COMPARE
Immigrants from Singapore
Bermudan
2 or more Vehicles in Household
2 or more Vehicles in Household Comparison
Immigrants from Singapore
Bermudans
53.9%
2 OR MORE VEHICLES IN HOUSEHOLD
6.3/ 100
METRIC RATING
221st/ 347
METRIC RANK
50.6%
2 OR MORE VEHICLES IN HOUSEHOLD
0.0/ 100
METRIC RATING
294th/ 347
METRIC RANK
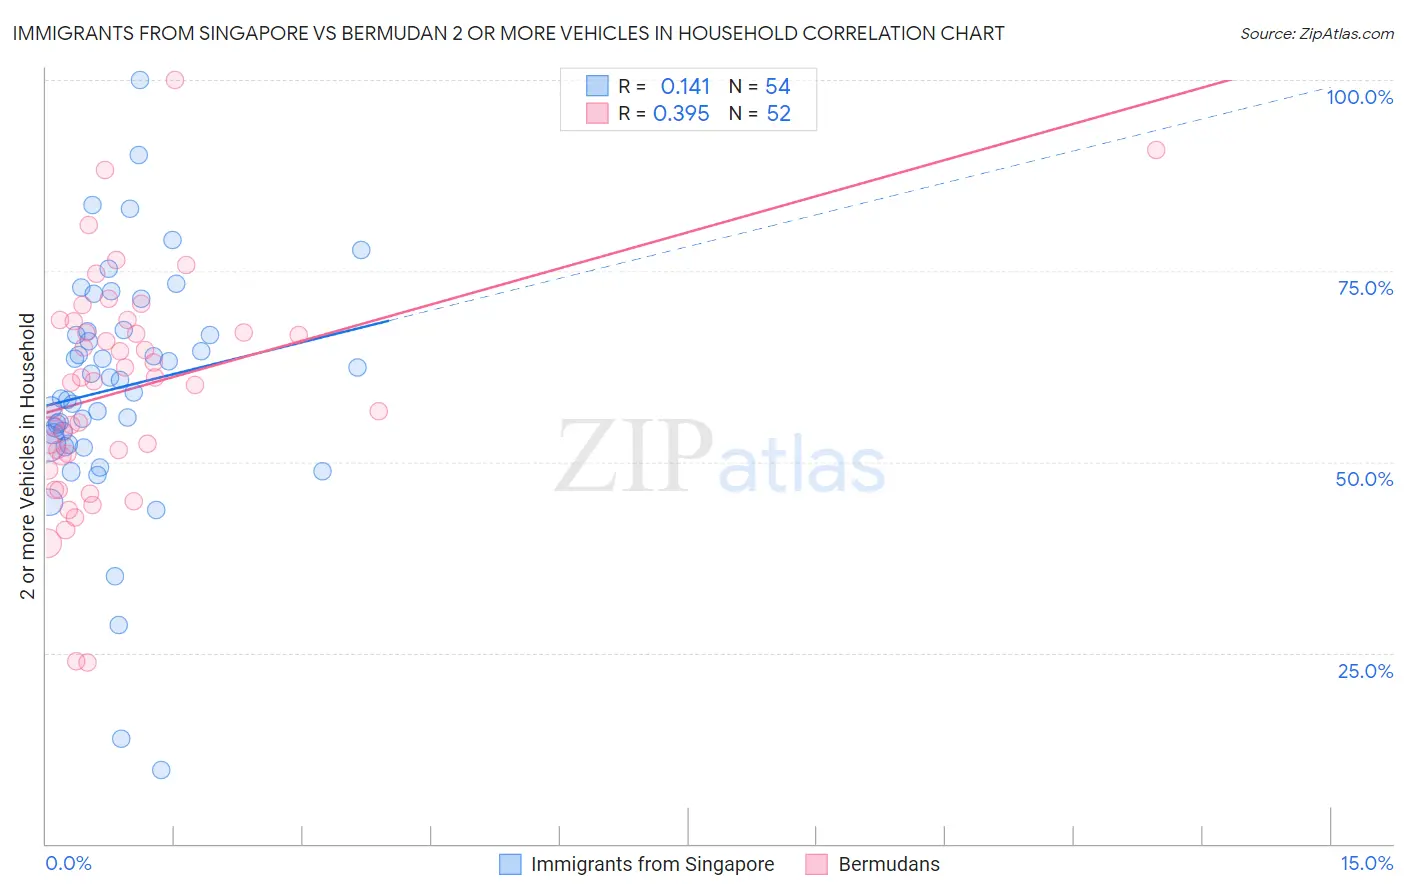
Immigrants from Singapore vs Bermudan 2 or more Vehicles in Household Correlation Chart
The statistical analysis conducted on geographies consisting of 137,464,640 people shows a poor positive correlation between the proportion of Immigrants from Singapore and percentage of households with 2 or more vehicles available in the United States with a correlation coefficient (R) of 0.141 and weighted average of 53.9%. Similarly, the statistical analysis conducted on geographies consisting of 55,716,623 people shows a mild positive correlation between the proportion of Bermudans and percentage of households with 2 or more vehicles available in the United States with a correlation coefficient (R) of 0.395 and weighted average of 50.6%, a difference of 6.5%.
2 or more Vehicles in Household Correlation Summary
| Measurement | Immigrants from Singapore | Bermudan |
| Minimum | 9.7% | 23.7% |
| Maximum | 100.0% | 100.0% |
| Range | 90.3% | 76.3% |
| Mean | 59.7% | 59.5% |
| Median | 59.9% | 60.5% |
| Interquartile 25% (IQ1) | 52.4% | 50.9% |
| Interquartile 75% (IQ3) | 67.1% | 67.6% |
| Interquartile Range (IQR) | 14.6% | 16.8% |
| Standard Deviation (Sample) | 15.9% | 14.7% |
| Standard Deviation (Population) | 15.7% | 14.6% |
Similar Demographics by 2 or more Vehicles in Household
Demographics Similar to Immigrants from Singapore by 2 or more Vehicles in Household
In terms of 2 or more vehicles in household, the demographic groups most similar to Immigrants from Singapore are Taiwanese (53.9%, a difference of 0.010%), Kiowa (53.9%, a difference of 0.010%), South American Indian (53.9%, a difference of 0.040%), Immigrants from Argentina (53.9%, a difference of 0.10%), and Immigrants from Burma/Myanmar (53.9%, a difference of 0.14%).
| Demographics | Rating | Rank | 2 or more Vehicles in Household |
| Immigrants | Czechoslovakia | 9.4 /100 | #214 | Tragic 54.1% |
| Aleuts | 9.3 /100 | #215 | Tragic 54.1% |
| Immigrants | Western Asia | 9.3 /100 | #216 | Tragic 54.1% |
| Immigrants | Burma/Myanmar | 7.1 /100 | #217 | Tragic 53.9% |
| Immigrants | Argentina | 6.8 /100 | #218 | Tragic 53.9% |
| South American Indians | 6.5 /100 | #219 | Tragic 53.9% |
| Taiwanese | 6.3 /100 | #220 | Tragic 53.9% |
| Immigrants | Singapore | 6.3 /100 | #221 | Tragic 53.9% |
| Kiowa | 6.2 /100 | #222 | Tragic 53.9% |
| Immigrants | Bosnia and Herzegovina | 5.5 /100 | #223 | Tragic 53.8% |
| Brazilians | 5.3 /100 | #224 | Tragic 53.8% |
| Immigrants | Egypt | 5.2 /100 | #225 | Tragic 53.8% |
| Immigrants | Eastern Africa | 5.1 /100 | #226 | Tragic 53.7% |
| Sudanese | 4.1 /100 | #227 | Tragic 53.6% |
| Alaska Natives | 3.9 /100 | #228 | Tragic 53.6% |
Demographics Similar to Bermudans by 2 or more Vehicles in Household
In terms of 2 or more vehicles in household, the demographic groups most similar to Bermudans are Cypriot (50.6%, a difference of 0.070%), Immigrants from Somalia (50.5%, a difference of 0.11%), Immigrants from Spain (50.4%, a difference of 0.38%), Paraguayan (50.3%, a difference of 0.51%), and Immigrants from Morocco (50.3%, a difference of 0.54%).
| Demographics | Rating | Rank | 2 or more Vehicles in Household |
| Immigrants | Serbia | 0.1 /100 | #287 | Tragic 51.3% |
| Okinawans | 0.1 /100 | #288 | Tragic 51.2% |
| Somalis | 0.0 /100 | #289 | Tragic 51.1% |
| Immigrants | Panama | 0.0 /100 | #290 | Tragic 51.1% |
| Belizeans | 0.0 /100 | #291 | Tragic 51.0% |
| Immigrants | Ukraine | 0.0 /100 | #292 | Tragic 50.9% |
| Blacks/African Americans | 0.0 /100 | #293 | Tragic 50.9% |
| Bermudans | 0.0 /100 | #294 | Tragic 50.6% |
| Cypriots | 0.0 /100 | #295 | Tragic 50.6% |
| Immigrants | Somalia | 0.0 /100 | #296 | Tragic 50.5% |
| Immigrants | Spain | 0.0 /100 | #297 | Tragic 50.4% |
| Paraguayans | 0.0 /100 | #298 | Tragic 50.3% |
| Immigrants | Morocco | 0.0 /100 | #299 | Tragic 50.3% |
| Immigrants | Russia | 0.0 /100 | #300 | Tragic 50.3% |
| Immigrants | Greece | 0.0 /100 | #301 | Tragic 50.2% |