Guatemalan vs Bermudan Associate's Degree
COMPARE
Guatemalan
Bermudan
Associate's Degree
Associate's Degree Comparison
Guatemalans
Bermudans
38.5%
ASSOCIATE'S DEGREE
0.0/ 100
METRIC RATING
303rd/ 347
METRIC RANK
46.2%
ASSOCIATE'S DEGREE
46.4/ 100
METRIC RATING
180th/ 347
METRIC RANK
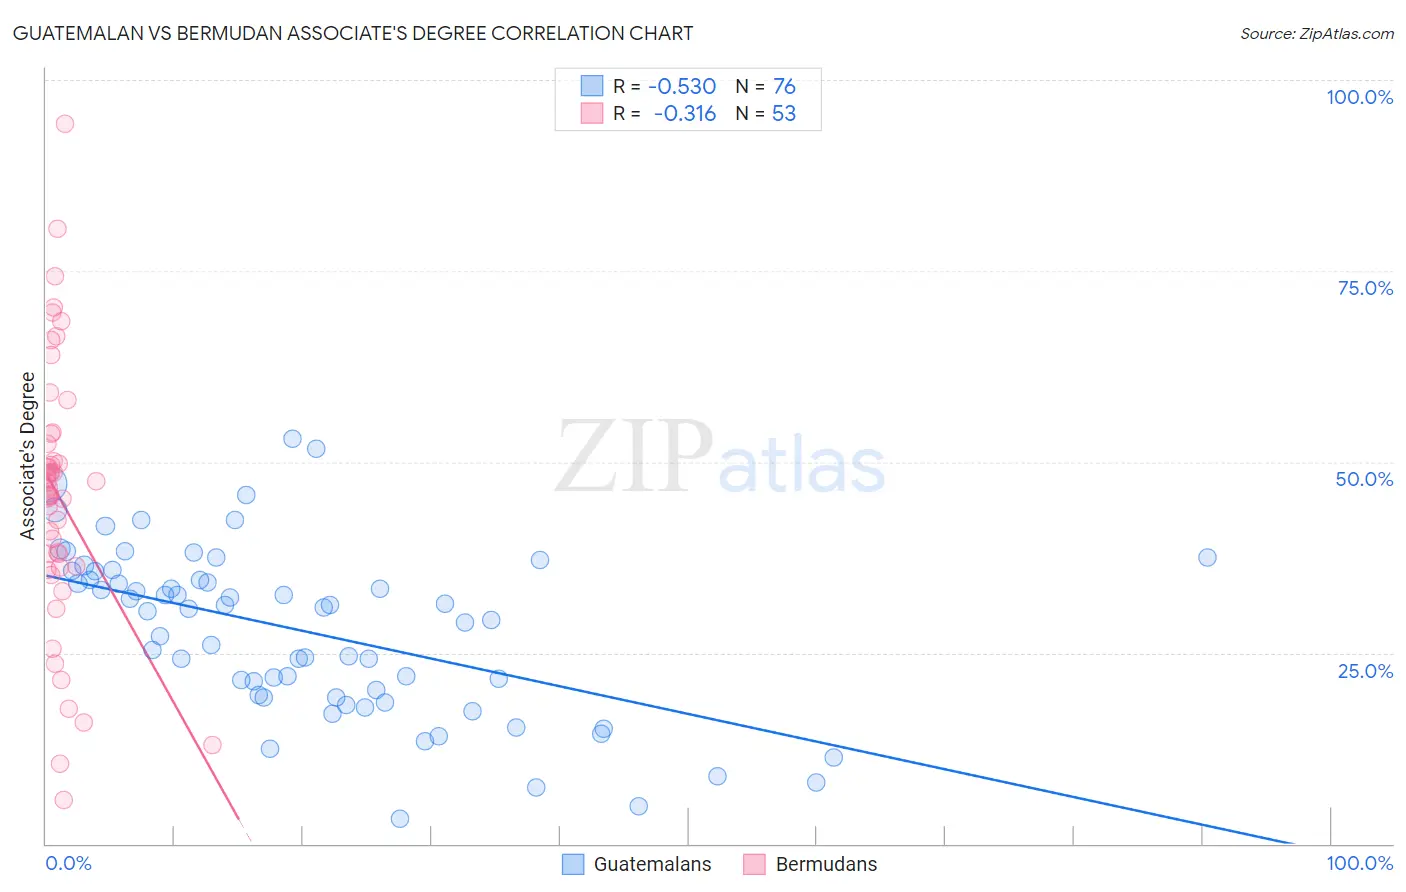
Guatemalan vs Bermudan Associate's Degree Correlation Chart
The statistical analysis conducted on geographies consisting of 409,533,584 people shows a substantial negative correlation between the proportion of Guatemalans and percentage of population with at least associate's degree education in the United States with a correlation coefficient (R) of -0.530 and weighted average of 38.5%. Similarly, the statistical analysis conducted on geographies consisting of 55,732,793 people shows a mild negative correlation between the proportion of Bermudans and percentage of population with at least associate's degree education in the United States with a correlation coefficient (R) of -0.316 and weighted average of 46.2%, a difference of 20.1%.
Associate's Degree Correlation Summary
| Measurement | Guatemalan | Bermudan |
| Minimum | 3.3% | 5.7% |
| Maximum | 53.1% | 94.2% |
| Range | 49.8% | 88.5% |
| Mean | 27.8% | 45.5% |
| Median | 30.6% | 46.6% |
| Interquartile 25% (IQ1) | 19.3% | 36.2% |
| Interquartile 75% (IQ3) | 35.1% | 53.0% |
| Interquartile Range (IQR) | 15.8% | 16.8% |
| Standard Deviation (Sample) | 11.0% | 17.5% |
| Standard Deviation (Population) | 10.9% | 17.4% |
Similar Demographics by Associate's Degree
Demographics Similar to Guatemalans by Associate's Degree
In terms of associate's degree, the demographic groups most similar to Guatemalans are Sioux (38.5%, a difference of 0.050%), Colville (38.5%, a difference of 0.090%), Immigrants from Honduras (38.5%, a difference of 0.12%), Shoshone (38.4%, a difference of 0.19%), and Immigrants from El Salvador (38.4%, a difference of 0.23%).
| Demographics | Rating | Rank | Associate's Degree |
| Cherokee | 0.0 /100 | #296 | Tragic 38.9% |
| Cape Verdeans | 0.0 /100 | #297 | Tragic 38.8% |
| Cheyenne | 0.0 /100 | #298 | Tragic 38.7% |
| Ute | 0.0 /100 | #299 | Tragic 38.6% |
| Chickasaw | 0.0 /100 | #300 | Tragic 38.6% |
| Tsimshian | 0.0 /100 | #301 | Tragic 38.6% |
| Colville | 0.0 /100 | #302 | Tragic 38.5% |
| Guatemalans | 0.0 /100 | #303 | Tragic 38.5% |
| Sioux | 0.0 /100 | #304 | Tragic 38.5% |
| Immigrants | Honduras | 0.0 /100 | #305 | Tragic 38.5% |
| Shoshone | 0.0 /100 | #306 | Tragic 38.4% |
| Immigrants | El Salvador | 0.0 /100 | #307 | Tragic 38.4% |
| Mexican American Indians | 0.0 /100 | #308 | Tragic 38.2% |
| Immigrants | Guatemala | 0.0 /100 | #309 | Tragic 38.1% |
| Immigrants | Dominican Republic | 0.0 /100 | #310 | Tragic 37.9% |
Demographics Similar to Bermudans by Associate's Degree
In terms of associate's degree, the demographic groups most similar to Bermudans are Sri Lankan (46.3%, a difference of 0.090%), Immigrants from Bosnia and Herzegovina (46.3%, a difference of 0.14%), Slovak (46.3%, a difference of 0.15%), Finnish (46.3%, a difference of 0.16%), and Belgian (46.3%, a difference of 0.19%).
| Demographics | Rating | Rank | Associate's Degree |
| Immigrants | Iraq | 50.3 /100 | #173 | Average 46.4% |
| English | 50.0 /100 | #174 | Average 46.4% |
| Belgians | 48.9 /100 | #175 | Average 46.3% |
| Finns | 48.5 /100 | #176 | Average 46.3% |
| Slovaks | 48.4 /100 | #177 | Average 46.3% |
| Immigrants | Bosnia and Herzegovina | 48.3 /100 | #178 | Average 46.3% |
| Sri Lankans | 47.6 /100 | #179 | Average 46.3% |
| Bermudans | 46.4 /100 | #180 | Average 46.2% |
| Immigrants | Colombia | 41.3 /100 | #181 | Average 46.0% |
| Swiss | 40.4 /100 | #182 | Average 46.0% |
| Yugoslavians | 40.2 /100 | #183 | Average 46.0% |
| Czechoslovakians | 40.0 /100 | #184 | Average 46.0% |
| Costa Ricans | 38.6 /100 | #185 | Fair 46.0% |
| Welsh | 37.9 /100 | #186 | Fair 45.9% |
| Immigrants | Uruguay | 35.5 /100 | #187 | Fair 45.8% |