Guatemalan vs Bermudan Per Capita Income
COMPARE
Guatemalan
Bermudan
Per Capita Income
Per Capita Income Comparison
Guatemalans
Bermudans
$37,766
PER CAPITA INCOME
0.1/ 100
METRIC RATING
285th/ 347
METRIC RANK
$42,911
PER CAPITA INCOME
30.1/ 100
METRIC RATING
189th/ 347
METRIC RANK
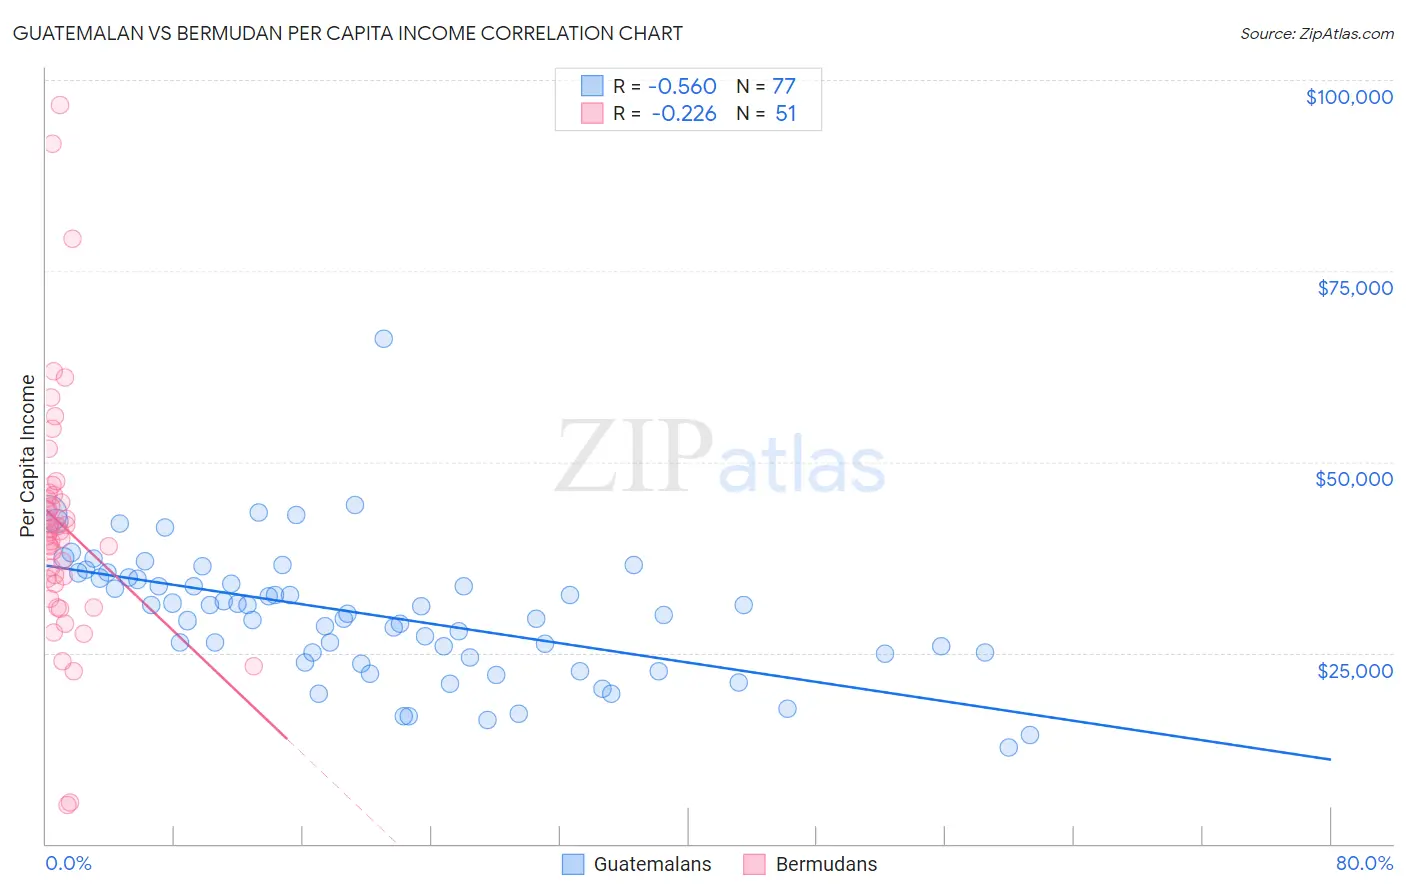
Guatemalan vs Bermudan Per Capita Income Correlation Chart
The statistical analysis conducted on geographies consisting of 409,586,498 people shows a substantial negative correlation between the proportion of Guatemalans and per capita income in the United States with a correlation coefficient (R) of -0.560 and weighted average of $37,766. Similarly, the statistical analysis conducted on geographies consisting of 55,728,704 people shows a weak negative correlation between the proportion of Bermudans and per capita income in the United States with a correlation coefficient (R) of -0.226 and weighted average of $42,911, a difference of 13.6%.
Per Capita Income Correlation Summary
| Measurement | Guatemalan | Bermudan |
| Minimum | $12,606 | $4,995 |
| Maximum | $66,145 | $96,710 |
| Range | $53,539 | $91,715 |
| Mean | $29,994 | $41,714 |
| Median | $30,165 | $40,756 |
| Interquartile 25% (IQ1) | $24,578 | $33,973 |
| Interquartile 75% (IQ3) | $34,822 | $45,741 |
| Interquartile Range (IQR) | $10,244 | $11,767 |
| Standard Deviation (Sample) | $8,508 | $16,477 |
| Standard Deviation (Population) | $8,452 | $16,314 |
Similar Demographics by Per Capita Income
Demographics Similar to Guatemalans by Per Capita Income
In terms of per capita income, the demographic groups most similar to Guatemalans are African ($37,785, a difference of 0.050%), Central American Indian ($37,699, a difference of 0.18%), Dominican ($37,697, a difference of 0.19%), Blackfeet ($37,695, a difference of 0.19%), and Pennsylvania German ($37,842, a difference of 0.20%).
| Demographics | Rating | Rank | Per Capita Income |
| Immigrants | Nicaragua | 0.2 /100 | #278 | Tragic $38,065 |
| Colville | 0.2 /100 | #279 | Tragic $38,047 |
| Potawatomi | 0.2 /100 | #280 | Tragic $38,046 |
| Immigrants | Dominica | 0.2 /100 | #281 | Tragic $37,952 |
| Immigrants | Laos | 0.1 /100 | #282 | Tragic $37,857 |
| Pennsylvania Germans | 0.1 /100 | #283 | Tragic $37,842 |
| Africans | 0.1 /100 | #284 | Tragic $37,785 |
| Guatemalans | 0.1 /100 | #285 | Tragic $37,766 |
| Central American Indians | 0.1 /100 | #286 | Tragic $37,699 |
| Dominicans | 0.1 /100 | #287 | Tragic $37,697 |
| Blackfeet | 0.1 /100 | #288 | Tragic $37,695 |
| U.S. Virgin Islanders | 0.1 /100 | #289 | Tragic $37,589 |
| Immigrants | Guatemala | 0.1 /100 | #290 | Tragic $37,550 |
| Cajuns | 0.1 /100 | #291 | Tragic $37,527 |
| Immigrants | Micronesia | 0.1 /100 | #292 | Tragic $37,464 |
Demographics Similar to Bermudans by Per Capita Income
In terms of per capita income, the demographic groups most similar to Bermudans are Immigrants from Africa ($42,950, a difference of 0.090%), Immigrants from Colombia ($42,971, a difference of 0.14%), French Canadian ($43,003, a difference of 0.21%), Immigrants ($43,010, a difference of 0.23%), and Kenyan ($42,808, a difference of 0.24%).
| Demographics | Rating | Rank | Per Capita Income |
| Immigrants | Vietnam | 38.1 /100 | #182 | Fair $43,229 |
| Germans | 33.9 /100 | #183 | Fair $43,067 |
| Spaniards | 32.9 /100 | #184 | Fair $43,028 |
| Immigrants | Immigrants | 32.5 /100 | #185 | Fair $43,010 |
| French Canadians | 32.3 /100 | #186 | Fair $43,003 |
| Immigrants | Colombia | 31.5 /100 | #187 | Fair $42,971 |
| Immigrants | Africa | 31.0 /100 | #188 | Fair $42,950 |
| Bermudans | 30.1 /100 | #189 | Fair $42,911 |
| Kenyans | 27.7 /100 | #190 | Fair $42,808 |
| Yugoslavians | 27.4 /100 | #191 | Fair $42,792 |
| Iraqis | 26.7 /100 | #192 | Fair $42,760 |
| Immigrants | Sierra Leone | 26.5 /100 | #193 | Fair $42,752 |
| Immigrants | Fiji | 25.2 /100 | #194 | Fair $42,694 |
| Immigrants | Kenya | 24.5 /100 | #195 | Fair $42,661 |
| Dutch | 23.4 /100 | #196 | Fair $42,605 |