Guatemalan vs Bermudan 7th Grade
COMPARE
Guatemalan
Bermudan
7th Grade
7th Grade Comparison
Guatemalans
Bermudans
91.7%
7TH GRADE
0.0/ 100
METRIC RATING
341st/ 347
METRIC RANK
96.1%
7TH GRADE
66.3/ 100
METRIC RATING
161st/ 347
METRIC RANK
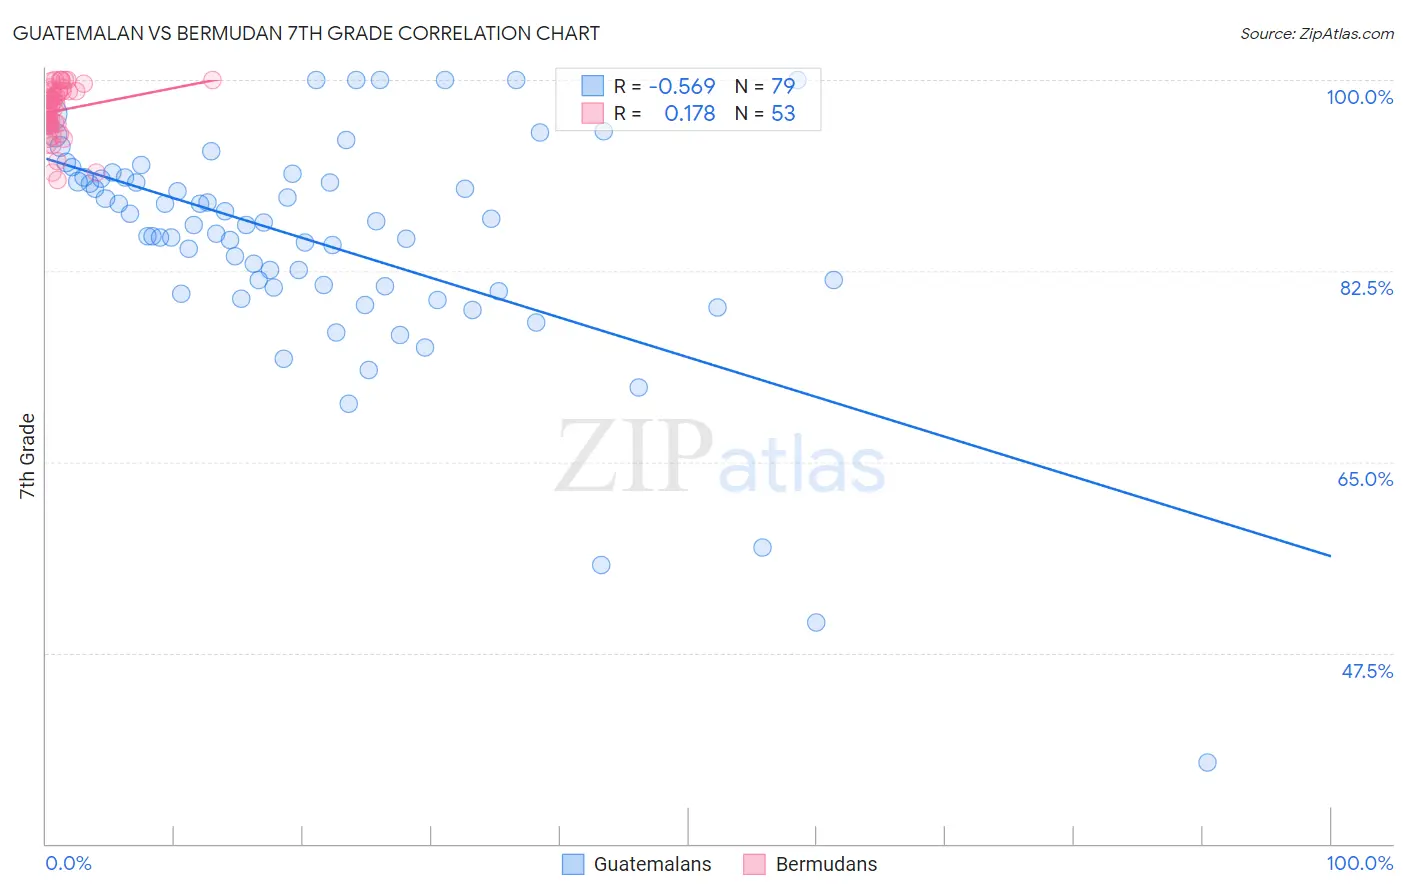
Guatemalan vs Bermudan 7th Grade Correlation Chart
The statistical analysis conducted on geographies consisting of 409,566,618 people shows a substantial negative correlation between the proportion of Guatemalans and percentage of population with at least 7th grade education in the United States with a correlation coefficient (R) of -0.569 and weighted average of 91.7%. Similarly, the statistical analysis conducted on geographies consisting of 55,732,793 people shows a poor positive correlation between the proportion of Bermudans and percentage of population with at least 7th grade education in the United States with a correlation coefficient (R) of 0.178 and weighted average of 96.1%, a difference of 4.8%.
7th Grade Correlation Summary
| Measurement | Guatemalan | Bermudan |
| Minimum | 37.5% | 90.8% |
| Maximum | 100.0% | 100.0% |
| Range | 62.5% | 9.2% |
| Mean | 85.1% | 97.2% |
| Median | 86.8% | 97.8% |
| Interquartile 25% (IQ1) | 81.0% | 95.9% |
| Interquartile 75% (IQ3) | 91.1% | 99.0% |
| Interquartile Range (IQR) | 10.1% | 3.1% |
| Standard Deviation (Sample) | 10.8% | 2.4% |
| Standard Deviation (Population) | 10.7% | 2.3% |
Similar Demographics by 7th Grade
Demographics Similar to Guatemalans by 7th Grade
In terms of 7th grade, the demographic groups most similar to Guatemalans are Yakama (91.7%, a difference of 0.020%), Mexican (91.9%, a difference of 0.21%), Salvadoran (91.5%, a difference of 0.27%), Immigrants from Guatemala (91.3%, a difference of 0.43%), and Central American (92.1%, a difference of 0.46%).
| Demographics | Rating | Rank | 7th Grade |
| Immigrants | Armenia | 0.0 /100 | #333 | Tragic 92.7% |
| Immigrants | Yemen | 0.0 /100 | #334 | Tragic 92.6% |
| Mexican American Indians | 0.0 /100 | #335 | Tragic 92.6% |
| Immigrants | Honduras | 0.0 /100 | #336 | Tragic 92.5% |
| Immigrants | Latin America | 0.0 /100 | #337 | Tragic 92.2% |
| Central Americans | 0.0 /100 | #338 | Tragic 92.1% |
| Mexicans | 0.0 /100 | #339 | Tragic 91.9% |
| Yakama | 0.0 /100 | #340 | Tragic 91.7% |
| Guatemalans | 0.0 /100 | #341 | Tragic 91.7% |
| Salvadorans | 0.0 /100 | #342 | Tragic 91.5% |
| Immigrants | Guatemala | 0.0 /100 | #343 | Tragic 91.3% |
| Immigrants | Central America | 0.0 /100 | #344 | Tragic 91.0% |
| Immigrants | El Salvador | 0.0 /100 | #345 | Tragic 90.9% |
| Immigrants | Mexico | 0.0 /100 | #346 | Tragic 90.7% |
| Spanish American Indians | 0.0 /100 | #347 | Tragic 90.3% |
Demographics Similar to Bermudans by 7th Grade
In terms of 7th grade, the demographic groups most similar to Bermudans are Immigrants from Kenya (96.1%, a difference of 0.0%), Alsatian (96.1%, a difference of 0.010%), Pima (96.1%, a difference of 0.010%), Arab (96.2%, a difference of 0.020%), and Spaniard (96.1%, a difference of 0.020%).
| Demographics | Rating | Rank | 7th Grade |
| Immigrants | Israel | 77.6 /100 | #154 | Good 96.2% |
| Immigrants | Jordan | 77.0 /100 | #155 | Good 96.2% |
| Kenyans | 76.2 /100 | #156 | Good 96.2% |
| Ugandans | 75.5 /100 | #157 | Good 96.2% |
| Arabs | 68.6 /100 | #158 | Good 96.2% |
| Alsatians | 67.2 /100 | #159 | Good 96.1% |
| Immigrants | Kenya | 66.8 /100 | #160 | Good 96.1% |
| Bermudans | 66.3 /100 | #161 | Good 96.1% |
| Pima | 64.3 /100 | #162 | Good 96.1% |
| Spaniards | 62.6 /100 | #163 | Good 96.1% |
| Immigrants | Italy | 62.1 /100 | #164 | Good 96.1% |
| Immigrants | Taiwan | 61.5 /100 | #165 | Good 96.1% |
| Immigrants | Kazakhstan | 61.0 /100 | #166 | Good 96.1% |
| Immigrants | Sri Lanka | 59.9 /100 | #167 | Average 96.1% |
| Immigrants | Poland | 59.0 /100 | #168 | Average 96.1% |