Yup'ik vs Immigrants from Australia No Vehicles in Household
COMPARE
Yup'ik
Immigrants from Australia
No Vehicles in Household
No Vehicles in Household Comparison
Yup'ik
Immigrants from Australia
45.9%
NO VEHICLES IN HOUSEHOLD
0.0/ 100
METRIC RATING
347th/ 347
METRIC RANK
13.8%
NO VEHICLES IN HOUSEHOLD
0.0/ 100
METRIC RATING
289th/ 347
METRIC RANK
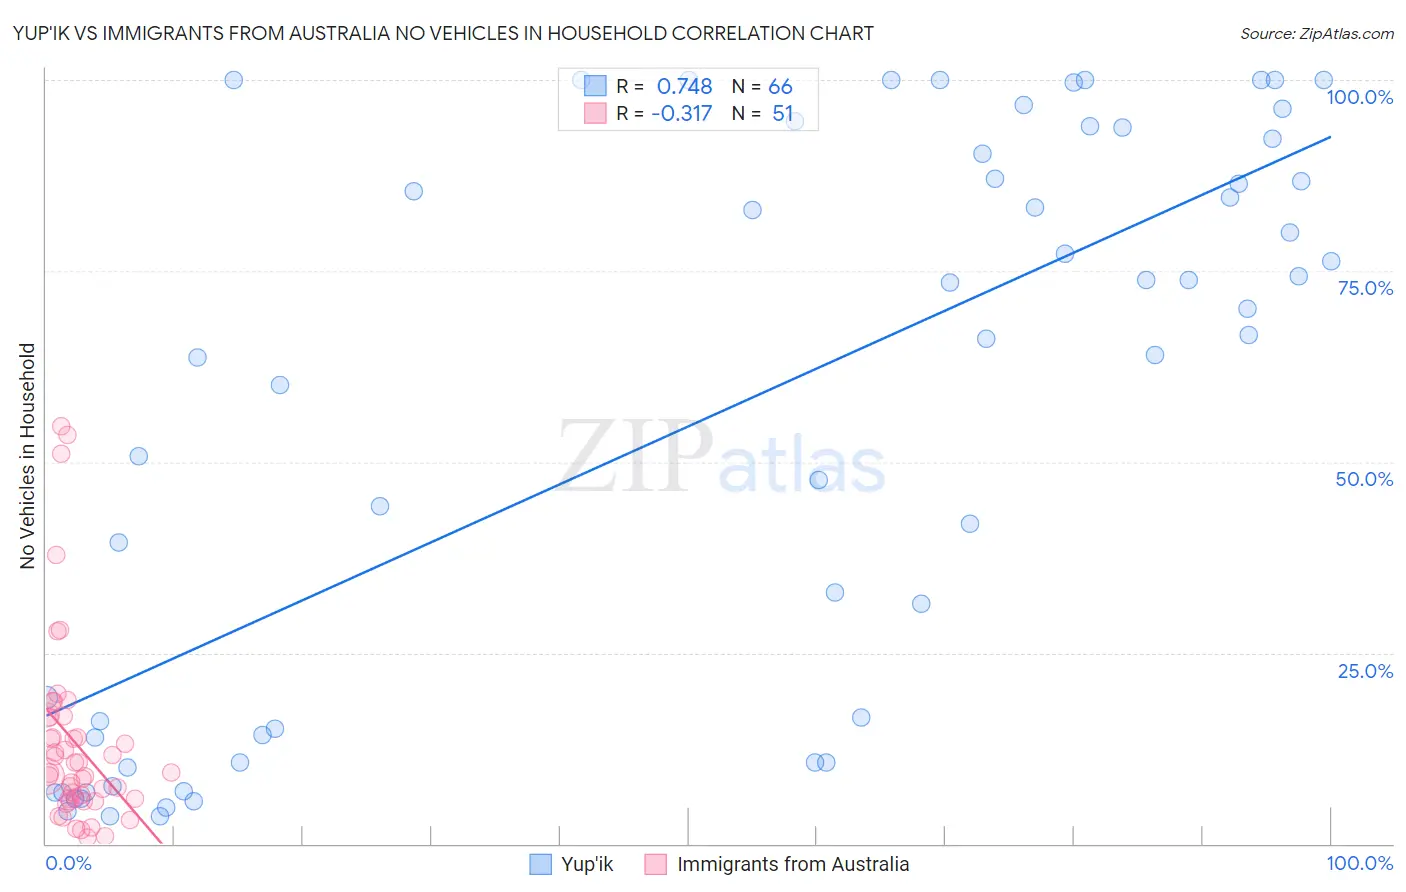
Yup'ik vs Immigrants from Australia No Vehicles in Household Correlation Chart
The statistical analysis conducted on geographies consisting of 39,930,704 people shows a strong positive correlation between the proportion of Yup'ik and percentage of households with no vehicle available in the United States with a correlation coefficient (R) of 0.748 and weighted average of 45.9%. Similarly, the statistical analysis conducted on geographies consisting of 226,784,291 people shows a mild negative correlation between the proportion of Immigrants from Australia and percentage of households with no vehicle available in the United States with a correlation coefficient (R) of -0.317 and weighted average of 13.8%, a difference of 232.0%.
No Vehicles in Household Correlation Summary
| Measurement | Yup'ik | Immigrants from Australia |
| Minimum | 3.5% | 0.88% |
| Maximum | 100.0% | 54.7% |
| Range | 96.5% | 53.8% |
| Mean | 55.6% | 13.1% |
| Median | 66.4% | 9.3% |
| Interquartile 25% (IQ1) | 14.0% | 5.9% |
| Interquartile 75% (IQ3) | 90.4% | 16.6% |
| Interquartile Range (IQR) | 76.4% | 10.7% |
| Standard Deviation (Sample) | 37.0% | 12.4% |
| Standard Deviation (Population) | 36.7% | 12.3% |
Similar Demographics by No Vehicles in Household
Demographics Similar to Yup'ik by No Vehicles in Household
In terms of no vehicles in household, the demographic groups most similar to Yup'ik are Immigrants from Grenada (37.5%, a difference of 22.5%), Immigrants from St. Vincent and the Grenadines (35.4%, a difference of 29.6%), Immigrants from Dominican Republic (31.4%, a difference of 46.0%), Inupiat (29.9%, a difference of 53.6%), and British West Indian (29.7%, a difference of 54.3%).
| Demographics | Rating | Rank | No Vehicles in Household |
| Immigrants | Trinidad and Tobago | 0.0 /100 | #333 | Tragic 24.6% |
| Immigrants | Bangladesh | 0.0 /100 | #334 | Tragic 25.8% |
| Barbadians | 0.0 /100 | #335 | Tragic 26.1% |
| Vietnamese | 0.0 /100 | #336 | Tragic 26.2% |
| Immigrants | Uzbekistan | 0.0 /100 | #337 | Tragic 26.7% |
| Guyanese | 0.0 /100 | #338 | Tragic 29.3% |
| Dominicans | 0.0 /100 | #339 | Tragic 29.4% |
| Immigrants | Barbados | 0.0 /100 | #340 | Tragic 29.5% |
| Immigrants | Guyana | 0.0 /100 | #341 | Tragic 29.5% |
| British West Indians | 0.0 /100 | #342 | Tragic 29.7% |
| Inupiat | 0.0 /100 | #343 | Tragic 29.9% |
| Immigrants | Dominican Republic | 0.0 /100 | #344 | Tragic 31.4% |
| Immigrants | St. Vincent and the Grenadines | 0.0 /100 | #345 | Tragic 35.4% |
| Immigrants | Grenada | 0.0 /100 | #346 | Tragic 37.5% |
| Yup'ik | 0.0 /100 | #347 | Tragic 45.9% |
Demographics Similar to Immigrants from Australia by No Vehicles in Household
In terms of no vehicles in household, the demographic groups most similar to Immigrants from Australia are Hopi (13.7%, a difference of 0.66%), Immigrants from Ireland (13.7%, a difference of 0.80%), Colville (13.7%, a difference of 1.0%), Immigrants from Eastern Europe (13.6%, a difference of 1.7%), and Immigrants from Malaysia (13.6%, a difference of 1.7%).
| Demographics | Rating | Rank | No Vehicles in Household |
| Immigrants | Eastern Asia | 0.0 /100 | #282 | Tragic 13.5% |
| Immigrants | Kazakhstan | 0.0 /100 | #283 | Tragic 13.6% |
| Immigrants | Malaysia | 0.0 /100 | #284 | Tragic 13.6% |
| Immigrants | Eastern Europe | 0.0 /100 | #285 | Tragic 13.6% |
| Colville | 0.0 /100 | #286 | Tragic 13.7% |
| Immigrants | Ireland | 0.0 /100 | #287 | Tragic 13.7% |
| Hopi | 0.0 /100 | #288 | Tragic 13.7% |
| Immigrants | Australia | 0.0 /100 | #289 | Tragic 13.8% |
| Indians (Asian) | 0.0 /100 | #290 | Tragic 14.1% |
| Okinawans | 0.0 /100 | #291 | Tragic 14.1% |
| Pima | 0.0 /100 | #292 | Tragic 14.1% |
| Immigrants | Jamaica | 0.0 /100 | #293 | Tragic 14.2% |
| Belizeans | 0.0 /100 | #294 | Tragic 14.3% |
| Paraguayans | 0.0 /100 | #295 | Tragic 14.4% |
| Immigrants | Spain | 0.0 /100 | #296 | Tragic 14.5% |