Immigrants from Liberia vs English No Vehicles in Household
COMPARE
Immigrants from Liberia
English
No Vehicles in Household
No Vehicles in Household Comparison
Immigrants from Liberia
English
12.2%
NO VEHICLES IN HOUSEHOLD
0.6/ 100
METRIC RATING
262nd/ 347
METRIC RANK
6.5%
NO VEHICLES IN HOUSEHOLD
100.0/ 100
METRIC RATING
3rd/ 347
METRIC RANK
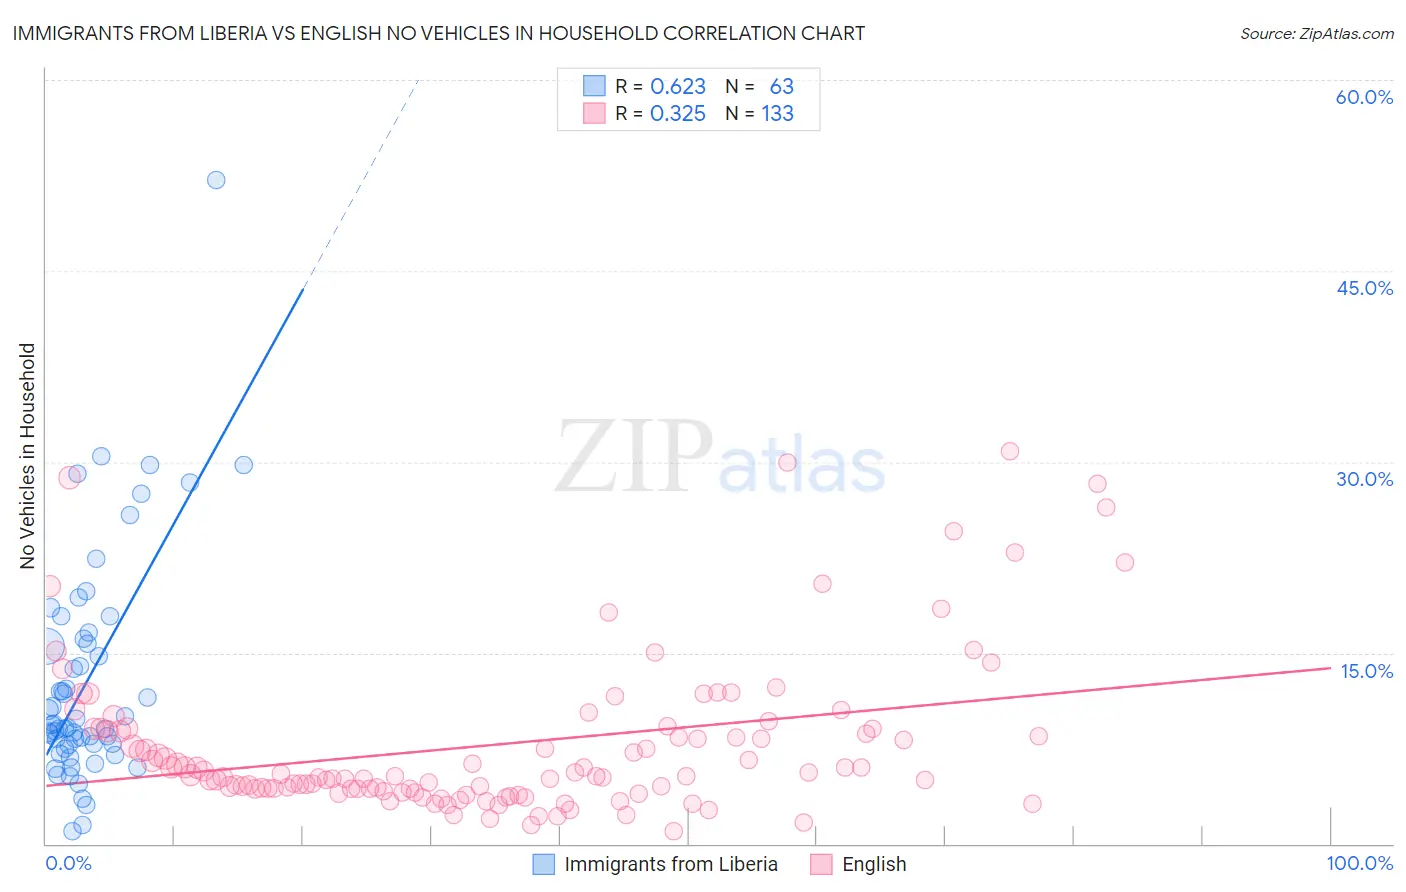
Immigrants from Liberia vs English No Vehicles in Household Correlation Chart
The statistical analysis conducted on geographies consisting of 135,196,776 people shows a significant positive correlation between the proportion of Immigrants from Liberia and percentage of households with no vehicle available in the United States with a correlation coefficient (R) of 0.623 and weighted average of 12.2%. Similarly, the statistical analysis conducted on geographies consisting of 572,648,684 people shows a mild positive correlation between the proportion of English and percentage of households with no vehicle available in the United States with a correlation coefficient (R) of 0.325 and weighted average of 6.5%, a difference of 87.7%.
No Vehicles in Household Correlation Summary
| Measurement | Immigrants from Liberia | English |
| Minimum | 0.97% | 1.0% |
| Maximum | 52.1% | 30.8% |
| Range | 51.2% | 29.8% |
| Mean | 12.8% | 7.8% |
| Median | 9.4% | 5.3% |
| Interquartile 25% (IQ1) | 7.8% | 4.3% |
| Interquartile 75% (IQ3) | 16.1% | 9.0% |
| Interquartile Range (IQR) | 8.3% | 4.7% |
| Standard Deviation (Sample) | 8.9% | 6.1% |
| Standard Deviation (Population) | 8.8% | 6.1% |
Similar Demographics by No Vehicles in Household
Demographics Similar to Immigrants from Liberia by No Vehicles in Household
In terms of no vehicles in household, the demographic groups most similar to Immigrants from Liberia are Subsaharan African (12.2%, a difference of 0.070%), Immigrants from Egypt (12.2%, a difference of 0.15%), Macedonian (12.2%, a difference of 0.46%), Immigrants from Switzerland (12.3%, a difference of 0.61%), and African (12.3%, a difference of 0.86%).
| Demographics | Rating | Rank | No Vehicles in Household |
| Hondurans | 1.2 /100 | #255 | Tragic 12.0% |
| Liberians | 1.2 /100 | #256 | Tragic 12.0% |
| Nigerians | 0.9 /100 | #257 | Tragic 12.1% |
| South American Indians | 0.9 /100 | #258 | Tragic 12.1% |
| Immigrants | Latvia | 0.8 /100 | #259 | Tragic 12.1% |
| Macedonians | 0.7 /100 | #260 | Tragic 12.2% |
| Sub-Saharan Africans | 0.6 /100 | #261 | Tragic 12.2% |
| Immigrants | Liberia | 0.6 /100 | #262 | Tragic 12.2% |
| Immigrants | Egypt | 0.6 /100 | #263 | Tragic 12.2% |
| Immigrants | Switzerland | 0.5 /100 | #264 | Tragic 12.3% |
| Africans | 0.4 /100 | #265 | Tragic 12.3% |
| Israelis | 0.3 /100 | #266 | Tragic 12.4% |
| Immigrants | Europe | 0.3 /100 | #267 | Tragic 12.5% |
| Immigrants | Africa | 0.2 /100 | #268 | Tragic 12.5% |
| Panamanians | 0.2 /100 | #269 | Tragic 12.5% |
Demographics Similar to English by No Vehicles in Household
In terms of no vehicles in household, the demographic groups most similar to English are Norwegian (6.4%, a difference of 1.1%), Danish (6.6%, a difference of 1.2%), Yakama (6.6%, a difference of 1.6%), German (6.7%, a difference of 2.6%), and Scottish (6.8%, a difference of 3.9%).
| Demographics | Rating | Rank | No Vehicles in Household |
| Luxembourgers | 100.0 /100 | #1 | Exceptional 5.4% |
| Norwegians | 100.0 /100 | #2 | Exceptional 6.4% |
| English | 100.0 /100 | #3 | Exceptional 6.5% |
| Danes | 100.0 /100 | #4 | Exceptional 6.6% |
| Yakama | 100.0 /100 | #5 | Exceptional 6.6% |
| Germans | 100.0 /100 | #6 | Exceptional 6.7% |
| Scottish | 100.0 /100 | #7 | Exceptional 6.8% |
| Swedes | 100.0 /100 | #8 | Exceptional 6.8% |
| Scotch-Irish | 100.0 /100 | #9 | Exceptional 6.8% |
| Dutch | 100.0 /100 | #10 | Exceptional 6.8% |
| Czechs | 100.0 /100 | #11 | Exceptional 6.9% |
| Assyrians/Chaldeans/Syriacs | 100.0 /100 | #12 | Exceptional 7.0% |
| Scandinavians | 100.0 /100 | #13 | Exceptional 7.0% |
| Mexicans | 100.0 /100 | #14 | Exceptional 7.0% |
| Whites/Caucasians | 100.0 /100 | #15 | Exceptional 7.0% |