German Russian vs Immigrants from Norway 2 or more Vehicles in Household
COMPARE
German Russian
Immigrants from Norway
2 or more Vehicles in Household
2 or more Vehicles in Household Comparison
German Russians
Immigrants from Norway
55.6%
2 OR MORE VEHICLES IN HOUSEHOLD
60.9/ 100
METRIC RATING
162nd/ 347
METRIC RANK
54.4%
2 OR MORE VEHICLES IN HOUSEHOLD
15.9/ 100
METRIC RATING
199th/ 347
METRIC RANK
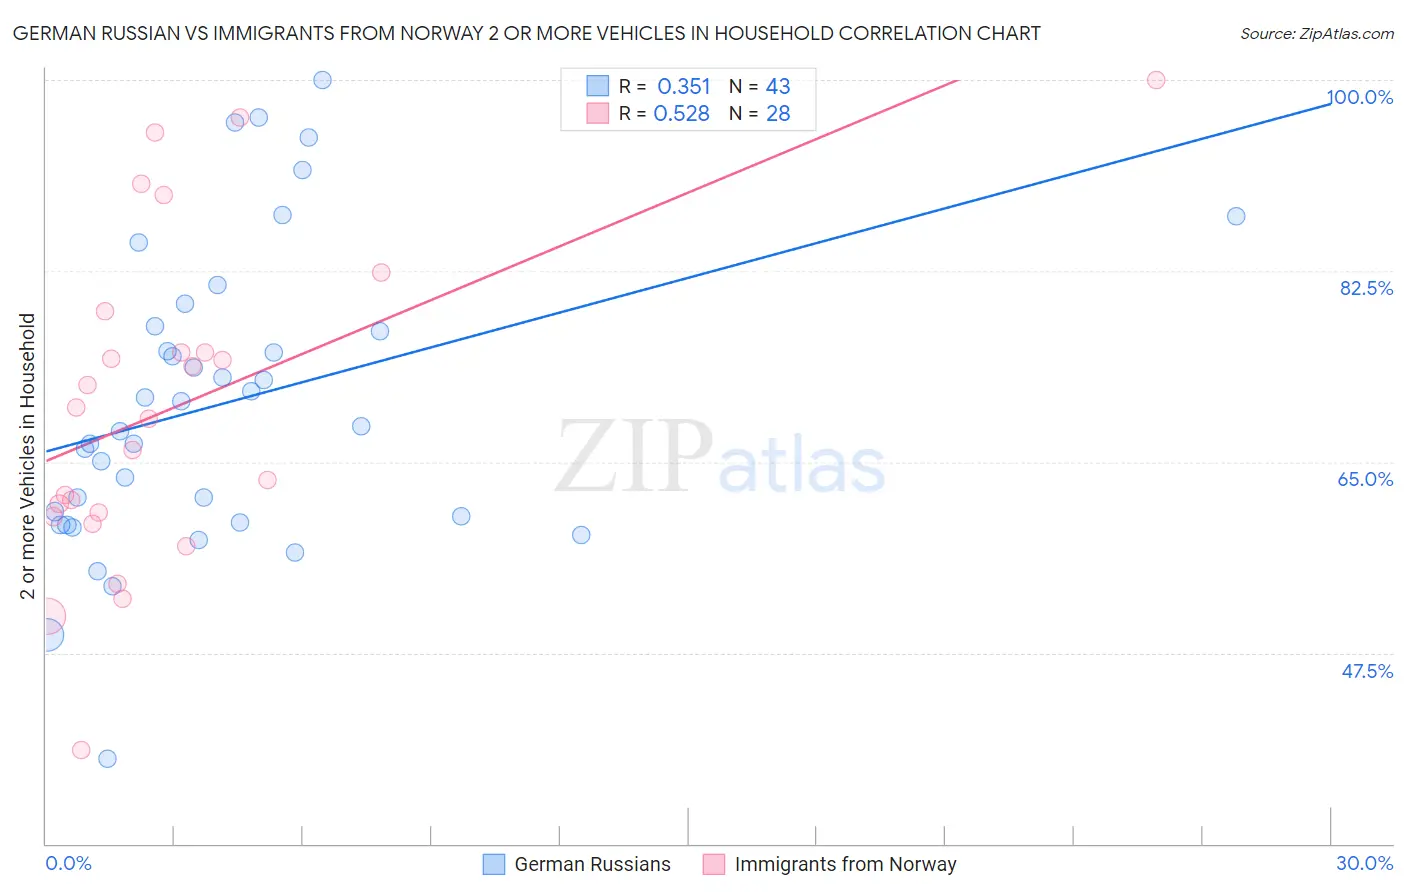
German Russian vs Immigrants from Norway 2 or more Vehicles in Household Correlation Chart
The statistical analysis conducted on geographies consisting of 96,451,375 people shows a mild positive correlation between the proportion of German Russians and percentage of households with 2 or more vehicles available in the United States with a correlation coefficient (R) of 0.351 and weighted average of 55.6%. Similarly, the statistical analysis conducted on geographies consisting of 116,688,411 people shows a substantial positive correlation between the proportion of Immigrants from Norway and percentage of households with 2 or more vehicles available in the United States with a correlation coefficient (R) of 0.528 and weighted average of 54.4%, a difference of 2.1%.
2 or more Vehicles in Household Correlation Summary
| Measurement | German Russian | Immigrants from Norway |
| Minimum | 37.7% | 38.6% |
| Maximum | 100.0% | 100.0% |
| Range | 62.3% | 61.4% |
| Mean | 70.3% | 70.1% |
| Median | 68.2% | 69.5% |
| Interquartile 25% (IQ1) | 59.5% | 60.2% |
| Interquartile 75% (IQ3) | 77.5% | 76.9% |
| Interquartile Range (IQR) | 18.0% | 16.7% |
| Standard Deviation (Sample) | 13.8% | 15.0% |
| Standard Deviation (Population) | 13.6% | 14.7% |
Similar Demographics by 2 or more Vehicles in Household
Demographics Similar to German Russians by 2 or more Vehicles in Household
In terms of 2 or more vehicles in household, the demographic groups most similar to German Russians are Colville (55.6%, a difference of 0.010%), Immigrants from Zimbabwe (55.6%, a difference of 0.030%), Dutch West Indian (55.6%, a difference of 0.040%), Immigrants from El Salvador (55.6%, a difference of 0.060%), and Immigrants from Sri Lanka (55.5%, a difference of 0.10%).
| Demographics | Rating | Rank | 2 or more Vehicles in Household |
| Immigrants | Venezuela | 70.7 /100 | #155 | Good 55.8% |
| Immigrants | Lithuania | 70.4 /100 | #156 | Good 55.8% |
| Immigrants | Kuwait | 70.2 /100 | #157 | Good 55.8% |
| Tlingit-Haida | 68.5 /100 | #158 | Good 55.8% |
| Paiute | 68.0 /100 | #159 | Good 55.8% |
| Crow | 67.0 /100 | #160 | Good 55.7% |
| Colville | 61.1 /100 | #161 | Good 55.6% |
| German Russians | 60.9 /100 | #162 | Good 55.6% |
| Immigrants | Zimbabwe | 60.2 /100 | #163 | Good 55.6% |
| Dutch West Indians | 59.8 /100 | #164 | Average 55.6% |
| Immigrants | El Salvador | 59.4 /100 | #165 | Average 55.6% |
| Immigrants | Sri Lanka | 58.3 /100 | #166 | Average 55.5% |
| Kenyans | 58.1 /100 | #167 | Average 55.5% |
| French American Indians | 56.7 /100 | #168 | Average 55.5% |
| Immigrants | Austria | 56.3 /100 | #169 | Average 55.5% |
Demographics Similar to Immigrants from Norway by 2 or more Vehicles in Household
In terms of 2 or more vehicles in household, the demographic groups most similar to Immigrants from Norway are Houma (54.4%, a difference of 0.0%), Carpatho Rusyn (54.4%, a difference of 0.030%), Immigrants from Italy (54.4%, a difference of 0.030%), Immigrants from North Macedonia (54.4%, a difference of 0.080%), and Argentinean (54.5%, a difference of 0.12%).
| Demographics | Rating | Rank | 2 or more Vehicles in Household |
| Immigrants | Romania | 23.8 /100 | #192 | Fair 54.7% |
| Immigrants | Japan | 23.4 /100 | #193 | Fair 54.7% |
| Central Americans | 23.0 /100 | #194 | Fair 54.7% |
| Iroquois | 22.6 /100 | #195 | Fair 54.7% |
| Immigrants | Poland | 19.3 /100 | #196 | Poor 54.6% |
| Argentineans | 17.5 /100 | #197 | Poor 54.5% |
| Carpatho Rusyns | 16.2 /100 | #198 | Poor 54.4% |
| Immigrants | Norway | 15.9 /100 | #199 | Poor 54.4% |
| Houma | 15.8 /100 | #200 | Poor 54.4% |
| Immigrants | Italy | 15.5 /100 | #201 | Poor 54.4% |
| Immigrants | North Macedonia | 14.9 /100 | #202 | Poor 54.4% |
| Immigrants | Peru | 14.3 /100 | #203 | Poor 54.4% |
| Immigrants | Belgium | 13.7 /100 | #204 | Poor 54.3% |
| Cheyenne | 13.6 /100 | #205 | Poor 54.3% |
| Immigrants | Latin America | 13.1 /100 | #206 | Poor 54.3% |