Estonian vs Luxembourger 3 or more Vehicles in Household
COMPARE
Estonian
Luxembourger
3 or more Vehicles in Household
3 or more Vehicles in Household Comparison
Estonians
Luxembourgers
19.7%
3 OR MORE VEHICLES IN HOUSEHOLD
63.2/ 100
METRIC RATING
162nd/ 347
METRIC RANK
20.9%
3 OR MORE VEHICLES IN HOUSEHOLD
97.7/ 100
METRIC RATING
104th/ 347
METRIC RANK
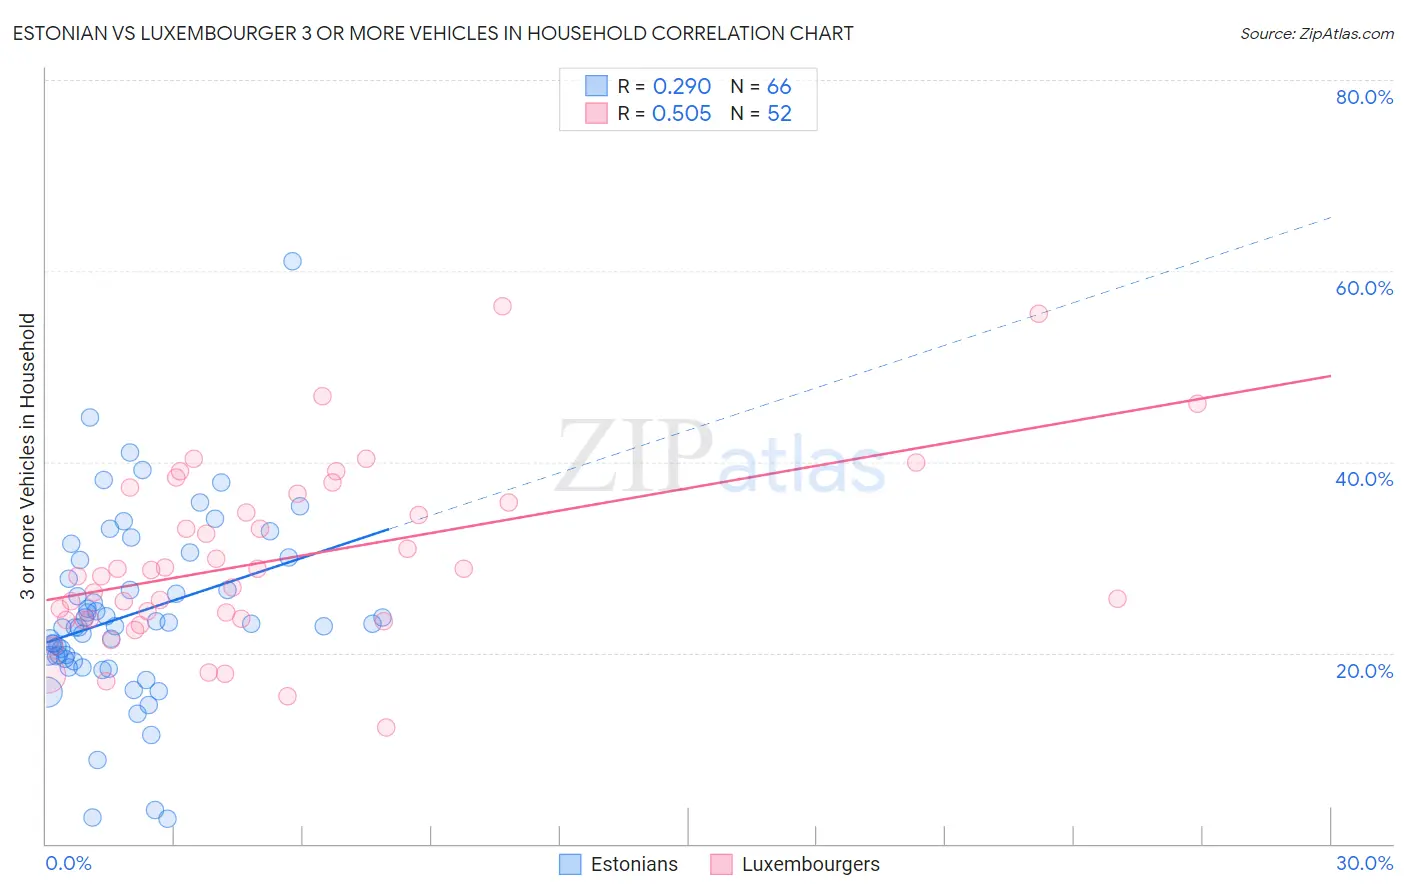
Estonian vs Luxembourger 3 or more Vehicles in Household Correlation Chart
The statistical analysis conducted on geographies consisting of 123,487,614 people shows a weak positive correlation between the proportion of Estonians and percentage of households with 3 or more vehicles available in the United States with a correlation coefficient (R) of 0.290 and weighted average of 19.7%. Similarly, the statistical analysis conducted on geographies consisting of 144,618,677 people shows a substantial positive correlation between the proportion of Luxembourgers and percentage of households with 3 or more vehicles available in the United States with a correlation coefficient (R) of 0.505 and weighted average of 20.9%, a difference of 6.0%.
3 or more Vehicles in Household Correlation Summary
| Measurement | Estonian | Luxembourger |
| Minimum | 2.6% | 12.2% |
| Maximum | 61.0% | 56.2% |
| Range | 58.5% | 44.1% |
| Mean | 24.1% | 29.8% |
| Median | 23.0% | 28.4% |
| Interquartile 25% (IQ1) | 19.4% | 23.5% |
| Interquartile 75% (IQ3) | 29.8% | 36.2% |
| Interquartile Range (IQR) | 10.3% | 12.7% |
| Standard Deviation (Sample) | 9.7% | 9.4% |
| Standard Deviation (Population) | 9.6% | 9.3% |
Similar Demographics by 3 or more Vehicles in Household
Demographics Similar to Estonians by 3 or more Vehicles in Household
In terms of 3 or more vehicles in household, the demographic groups most similar to Estonians are Chilean (19.7%, a difference of 0.020%), Yugoslavian (19.7%, a difference of 0.030%), Immigrants from Costa Rica (19.7%, a difference of 0.11%), Immigrants from Guatemala (19.7%, a difference of 0.19%), and Immigrants from Cameroon (19.7%, a difference of 0.19%).
| Demographics | Rating | Rank | 3 or more Vehicles in Household |
| Tlingit-Haida | 73.4 /100 | #155 | Good 19.9% |
| Thais | 71.1 /100 | #156 | Good 19.8% |
| Hungarians | 70.5 /100 | #157 | Good 19.8% |
| Armenians | 68.8 /100 | #158 | Good 19.8% |
| Immigrants | Pakistan | 68.2 /100 | #159 | Good 19.8% |
| Immigrants | Lebanon | 67.6 /100 | #160 | Good 19.8% |
| Immigrants | Guatemala | 65.6 /100 | #161 | Good 19.7% |
| Estonians | 63.2 /100 | #162 | Good 19.7% |
| Chileans | 63.0 /100 | #163 | Good 19.7% |
| Yugoslavians | 62.9 /100 | #164 | Good 19.7% |
| Immigrants | Costa Rica | 61.9 /100 | #165 | Good 19.7% |
| Immigrants | Cameroon | 60.9 /100 | #166 | Good 19.7% |
| Ukrainians | 58.9 /100 | #167 | Average 19.6% |
| Peruvians | 58.8 /100 | #168 | Average 19.6% |
| Immigrants | Denmark | 57.6 /100 | #169 | Average 19.6% |
Demographics Similar to Luxembourgers by 3 or more Vehicles in Household
In terms of 3 or more vehicles in household, the demographic groups most similar to Luxembourgers are Dutch West Indian (20.9%, a difference of 0.080%), Austrian (20.9%, a difference of 0.10%), Seminole (20.9%, a difference of 0.12%), Blackfeet (20.9%, a difference of 0.15%), and Bolivian (20.8%, a difference of 0.20%).
| Demographics | Rating | Rank | 3 or more Vehicles in Household |
| Canadians | 98.3 /100 | #97 | Exceptional 21.0% |
| Hmong | 98.2 /100 | #98 | Exceptional 21.0% |
| Alaska Natives | 98.2 /100 | #99 | Exceptional 21.0% |
| Comanche | 98.2 /100 | #100 | Exceptional 21.0% |
| Blackfeet | 97.9 /100 | #101 | Exceptional 20.9% |
| Seminole | 97.8 /100 | #102 | Exceptional 20.9% |
| Dutch West Indians | 97.8 /100 | #103 | Exceptional 20.9% |
| Luxembourgers | 97.7 /100 | #104 | Exceptional 20.9% |
| Austrians | 97.5 /100 | #105 | Exceptional 20.9% |
| Bolivians | 97.4 /100 | #106 | Exceptional 20.8% |
| Immigrants | Germany | 97.4 /100 | #107 | Exceptional 20.8% |
| Immigrants | Scotland | 97.1 /100 | #108 | Exceptional 20.8% |
| Filipinos | 97.0 /100 | #109 | Exceptional 20.8% |
| Asians | 96.8 /100 | #110 | Exceptional 20.8% |
| Immigrants | Micronesia | 96.7 /100 | #111 | Exceptional 20.7% |