Estonian vs Immigrants from Bosnia and Herzegovina 3 or more Vehicles in Household
COMPARE
Estonian
Immigrants from Bosnia and Herzegovina
3 or more Vehicles in Household
3 or more Vehicles in Household Comparison
Estonians
Immigrants from Bosnia and Herzegovina
19.7%
3 OR MORE VEHICLES IN HOUSEHOLD
63.2/ 100
METRIC RATING
162nd/ 347
METRIC RANK
17.5%
3 OR MORE VEHICLES IN HOUSEHOLD
0.5/ 100
METRIC RATING
274th/ 347
METRIC RANK
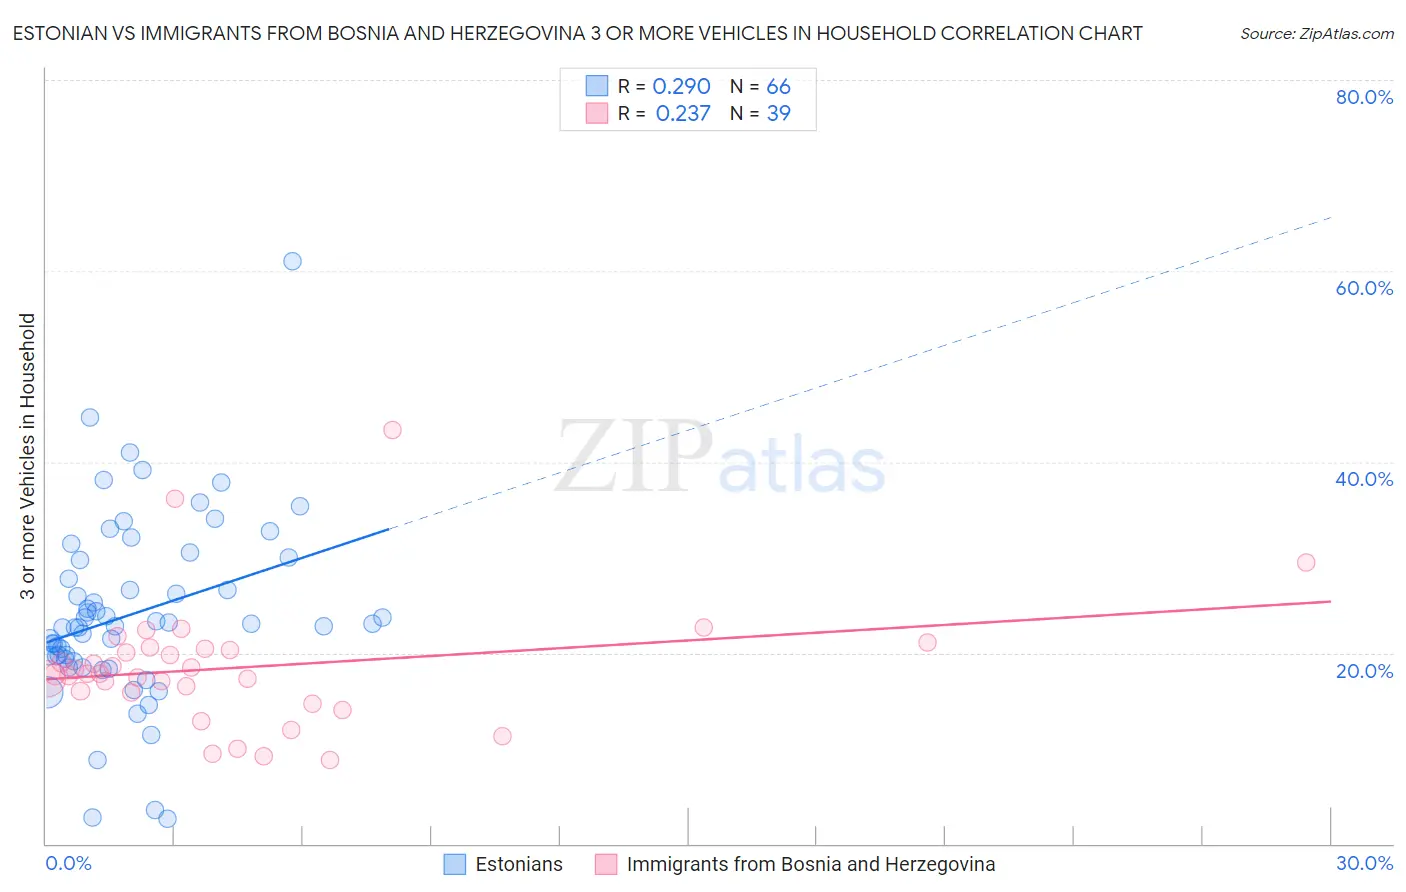
Estonian vs Immigrants from Bosnia and Herzegovina 3 or more Vehicles in Household Correlation Chart
The statistical analysis conducted on geographies consisting of 123,487,614 people shows a weak positive correlation between the proportion of Estonians and percentage of households with 3 or more vehicles available in the United States with a correlation coefficient (R) of 0.290 and weighted average of 19.7%. Similarly, the statistical analysis conducted on geographies consisting of 156,800,746 people shows a weak positive correlation between the proportion of Immigrants from Bosnia and Herzegovina and percentage of households with 3 or more vehicles available in the United States with a correlation coefficient (R) of 0.237 and weighted average of 17.5%, a difference of 12.4%.
3 or more Vehicles in Household Correlation Summary
| Measurement | Estonian | Immigrants from Bosnia and Herzegovina |
| Minimum | 2.6% | 8.8% |
| Maximum | 61.0% | 43.4% |
| Range | 58.5% | 34.6% |
| Mean | 24.1% | 18.5% |
| Median | 23.0% | 17.8% |
| Interquartile 25% (IQ1) | 19.4% | 15.8% |
| Interquartile 75% (IQ3) | 29.8% | 20.4% |
| Interquartile Range (IQR) | 10.3% | 4.7% |
| Standard Deviation (Sample) | 9.7% | 6.6% |
| Standard Deviation (Population) | 9.6% | 6.5% |
Similar Demographics by 3 or more Vehicles in Household
Demographics Similar to Estonians by 3 or more Vehicles in Household
In terms of 3 or more vehicles in household, the demographic groups most similar to Estonians are Chilean (19.7%, a difference of 0.020%), Yugoslavian (19.7%, a difference of 0.030%), Immigrants from Costa Rica (19.7%, a difference of 0.11%), Immigrants from Guatemala (19.7%, a difference of 0.19%), and Immigrants from Cameroon (19.7%, a difference of 0.19%).
| Demographics | Rating | Rank | 3 or more Vehicles in Household |
| Tlingit-Haida | 73.4 /100 | #155 | Good 19.9% |
| Thais | 71.1 /100 | #156 | Good 19.8% |
| Hungarians | 70.5 /100 | #157 | Good 19.8% |
| Armenians | 68.8 /100 | #158 | Good 19.8% |
| Immigrants | Pakistan | 68.2 /100 | #159 | Good 19.8% |
| Immigrants | Lebanon | 67.6 /100 | #160 | Good 19.8% |
| Immigrants | Guatemala | 65.6 /100 | #161 | Good 19.7% |
| Estonians | 63.2 /100 | #162 | Good 19.7% |
| Chileans | 63.0 /100 | #163 | Good 19.7% |
| Yugoslavians | 62.9 /100 | #164 | Good 19.7% |
| Immigrants | Costa Rica | 61.9 /100 | #165 | Good 19.7% |
| Immigrants | Cameroon | 60.9 /100 | #166 | Good 19.7% |
| Ukrainians | 58.9 /100 | #167 | Average 19.6% |
| Peruvians | 58.8 /100 | #168 | Average 19.6% |
| Immigrants | Denmark | 57.6 /100 | #169 | Average 19.6% |
Demographics Similar to Immigrants from Bosnia and Herzegovina by 3 or more Vehicles in Household
In terms of 3 or more vehicles in household, the demographic groups most similar to Immigrants from Bosnia and Herzegovina are Immigrants from Sudan (17.6%, a difference of 0.15%), Immigrants from Africa (17.6%, a difference of 0.18%), Immigrants from Ukraine (17.5%, a difference of 0.29%), Okinawan (17.4%, a difference of 0.45%), and Brazilian (17.4%, a difference of 0.59%).
| Demographics | Rating | Rank | 3 or more Vehicles in Household |
| Immigrants | Venezuela | 0.8 /100 | #267 | Tragic 17.7% |
| Immigrants | Bulgaria | 0.8 /100 | #268 | Tragic 17.7% |
| Immigrants | France | 0.6 /100 | #269 | Tragic 17.6% |
| Immigrants | Nepal | 0.6 /100 | #270 | Tragic 17.6% |
| South Americans | 0.6 /100 | #271 | Tragic 17.6% |
| Immigrants | Africa | 0.5 /100 | #272 | Tragic 17.6% |
| Immigrants | Sudan | 0.5 /100 | #273 | Tragic 17.6% |
| Immigrants | Bosnia and Herzegovina | 0.5 /100 | #274 | Tragic 17.5% |
| Immigrants | Ukraine | 0.4 /100 | #275 | Tragic 17.5% |
| Okinawans | 0.4 /100 | #276 | Tragic 17.4% |
| Brazilians | 0.4 /100 | #277 | Tragic 17.4% |
| Immigrants | Bahamas | 0.3 /100 | #278 | Tragic 17.4% |
| Immigrants | Kazakhstan | 0.3 /100 | #279 | Tragic 17.4% |
| Immigrants | Eastern Europe | 0.3 /100 | #280 | Tragic 17.4% |
| Immigrants | Latvia | 0.3 /100 | #281 | Tragic 17.4% |