English vs Immigrants from Latvia 4 or more Vehicles in Household
COMPARE
English
Immigrants from Latvia
4 or more Vehicles in Household
4 or more Vehicles in Household Comparison
English
Immigrants from Latvia
7.6%
4 OR MORE VEHICLES IN HOUSEHOLD
100.0/ 100
METRIC RATING
56th/ 347
METRIC RANK
5.5%
4 OR MORE VEHICLES IN HOUSEHOLD
0.5/ 100
METRIC RATING
276th/ 347
METRIC RANK
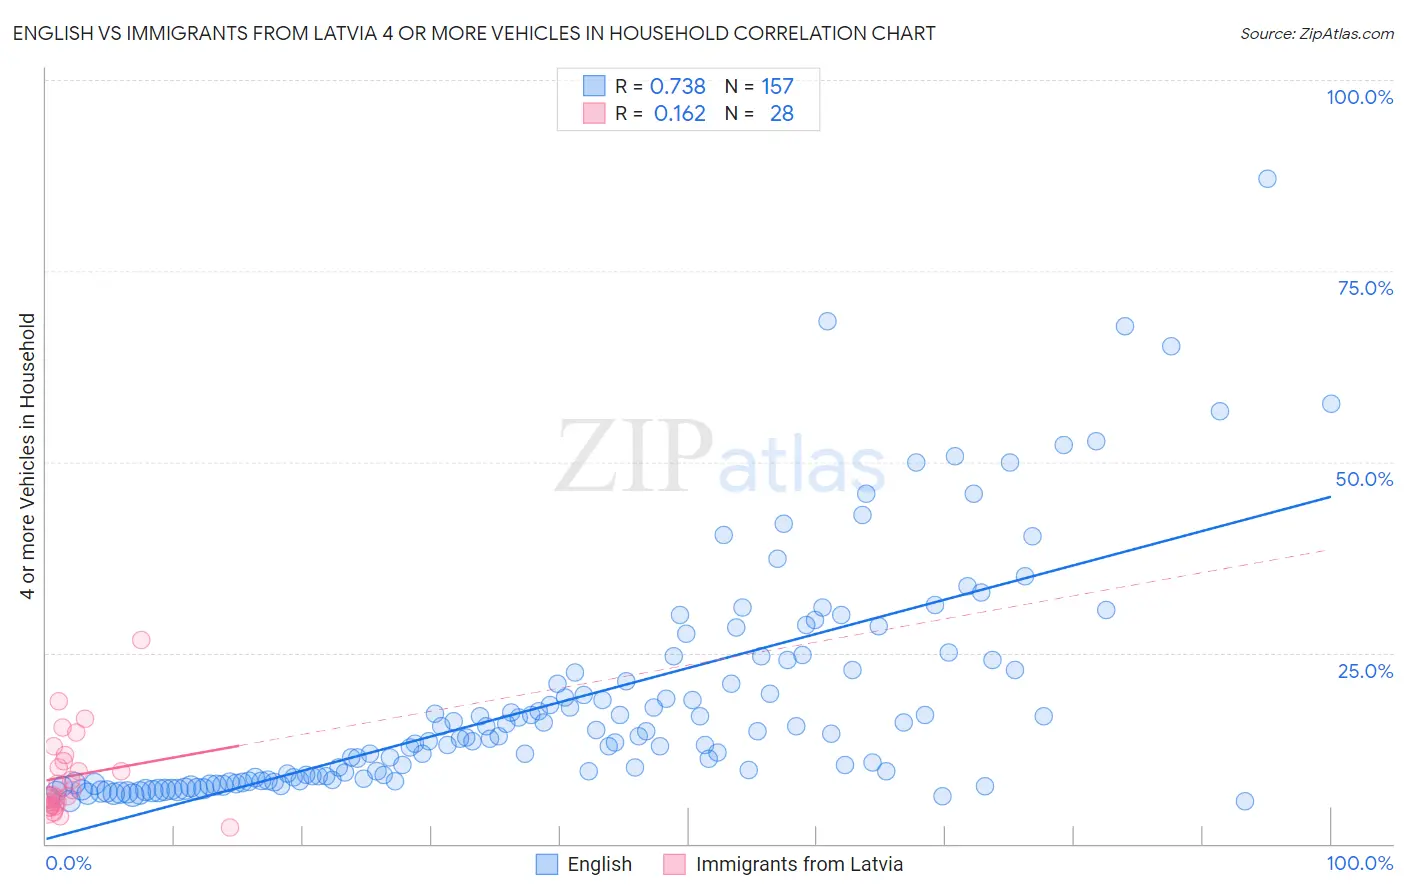
English vs Immigrants from Latvia 4 or more Vehicles in Household Correlation Chart
The statistical analysis conducted on geographies consisting of 575,671,099 people shows a strong positive correlation between the proportion of English and percentage of households with 4 or more vehicles available in the United States with a correlation coefficient (R) of 0.738 and weighted average of 7.6%. Similarly, the statistical analysis conducted on geographies consisting of 113,394,879 people shows a poor positive correlation between the proportion of Immigrants from Latvia and percentage of households with 4 or more vehicles available in the United States with a correlation coefficient (R) of 0.162 and weighted average of 5.5%, a difference of 39.0%.
4 or more Vehicles in Household Correlation Summary
| Measurement | English | Immigrants from Latvia |
| Minimum | 5.6% | 2.0% |
| Maximum | 87.1% | 26.8% |
| Range | 81.5% | 24.7% |
| Mean | 18.6% | 8.9% |
| Median | 13.7% | 6.7% |
| Interquartile 25% (IQ1) | 8.3% | 5.0% |
| Interquartile 75% (IQ3) | 22.8% | 11.2% |
| Interquartile Range (IQR) | 14.5% | 6.2% |
| Standard Deviation (Sample) | 14.8% | 5.5% |
| Standard Deviation (Population) | 14.8% | 5.4% |
Similar Demographics by 4 or more Vehicles in Household
Demographics Similar to English by 4 or more Vehicles in Household
In terms of 4 or more vehicles in household, the demographic groups most similar to English are Immigrants from Oceania (7.6%, a difference of 0.010%), Pennsylvania German (7.6%, a difference of 0.12%), Swedish (7.6%, a difference of 0.12%), Hispanic or Latino (7.6%, a difference of 0.16%), and Spaniard (7.6%, a difference of 0.22%).
| Demographics | Rating | Rank | 4 or more Vehicles in Household |
| Cherokee | 100.0 /100 | #49 | Exceptional 7.7% |
| Immigrants | El Salvador | 100.0 /100 | #50 | Exceptional 7.7% |
| Immigrants | Laos | 100.0 /100 | #51 | Exceptional 7.7% |
| Japanese | 100.0 /100 | #52 | Exceptional 7.7% |
| Malaysians | 100.0 /100 | #53 | Exceptional 7.7% |
| Dutch | 100.0 /100 | #54 | Exceptional 7.7% |
| Immigrants | Oceania | 100.0 /100 | #55 | Exceptional 7.6% |
| English | 100.0 /100 | #56 | Exceptional 7.6% |
| Pennsylvania Germans | 100.0 /100 | #57 | Exceptional 7.6% |
| Swedes | 100.0 /100 | #58 | Exceptional 7.6% |
| Hispanics or Latinos | 100.0 /100 | #59 | Exceptional 7.6% |
| Spaniards | 100.0 /100 | #60 | Exceptional 7.6% |
| Europeans | 100.0 /100 | #61 | Exceptional 7.6% |
| Chippewa | 100.0 /100 | #62 | Exceptional 7.6% |
| Immigrants | Micronesia | 100.0 /100 | #63 | Exceptional 7.6% |
Demographics Similar to Immigrants from Latvia by 4 or more Vehicles in Household
In terms of 4 or more vehicles in household, the demographic groups most similar to Immigrants from Latvia are Cambodian (5.5%, a difference of 0.010%), Immigrants from Bulgaria (5.5%, a difference of 0.12%), Black/African American (5.5%, a difference of 0.13%), Macedonian (5.5%, a difference of 0.25%), and Immigrants from Kazakhstan (5.5%, a difference of 0.28%).
| Demographics | Rating | Rank | 4 or more Vehicles in Household |
| Carpatho Rusyns | 0.7 /100 | #269 | Tragic 5.5% |
| Okinawans | 0.6 /100 | #270 | Tragic 5.5% |
| Immigrants | Sudan | 0.6 /100 | #271 | Tragic 5.5% |
| Immigrants | Kazakhstan | 0.6 /100 | #272 | Tragic 5.5% |
| Macedonians | 0.6 /100 | #273 | Tragic 5.5% |
| Blacks/African Americans | 0.6 /100 | #274 | Tragic 5.5% |
| Cambodians | 0.5 /100 | #275 | Tragic 5.5% |
| Immigrants | Latvia | 0.5 /100 | #276 | Tragic 5.5% |
| Immigrants | Bulgaria | 0.5 /100 | #277 | Tragic 5.5% |
| Immigrants | Eastern Europe | 0.4 /100 | #278 | Tragic 5.4% |
| Immigrants | Uruguay | 0.3 /100 | #279 | Tragic 5.4% |
| Alsatians | 0.3 /100 | #280 | Tragic 5.4% |
| Immigrants | Western Africa | 0.3 /100 | #281 | Tragic 5.4% |
| Immigrants | Spain | 0.3 /100 | #282 | Tragic 5.4% |
| Immigrants | Ireland | 0.3 /100 | #283 | Tragic 5.4% |