Peruvian vs Immigrants from Latvia 4 or more Vehicles in Household
COMPARE
Peruvian
Immigrants from Latvia
4 or more Vehicles in Household
4 or more Vehicles in Household Comparison
Peruvians
Immigrants from Latvia
6.5%
4 OR MORE VEHICLES IN HOUSEHOLD
69.4/ 100
METRIC RATING
157th/ 347
METRIC RANK
5.5%
4 OR MORE VEHICLES IN HOUSEHOLD
0.5/ 100
METRIC RATING
276th/ 347
METRIC RANK
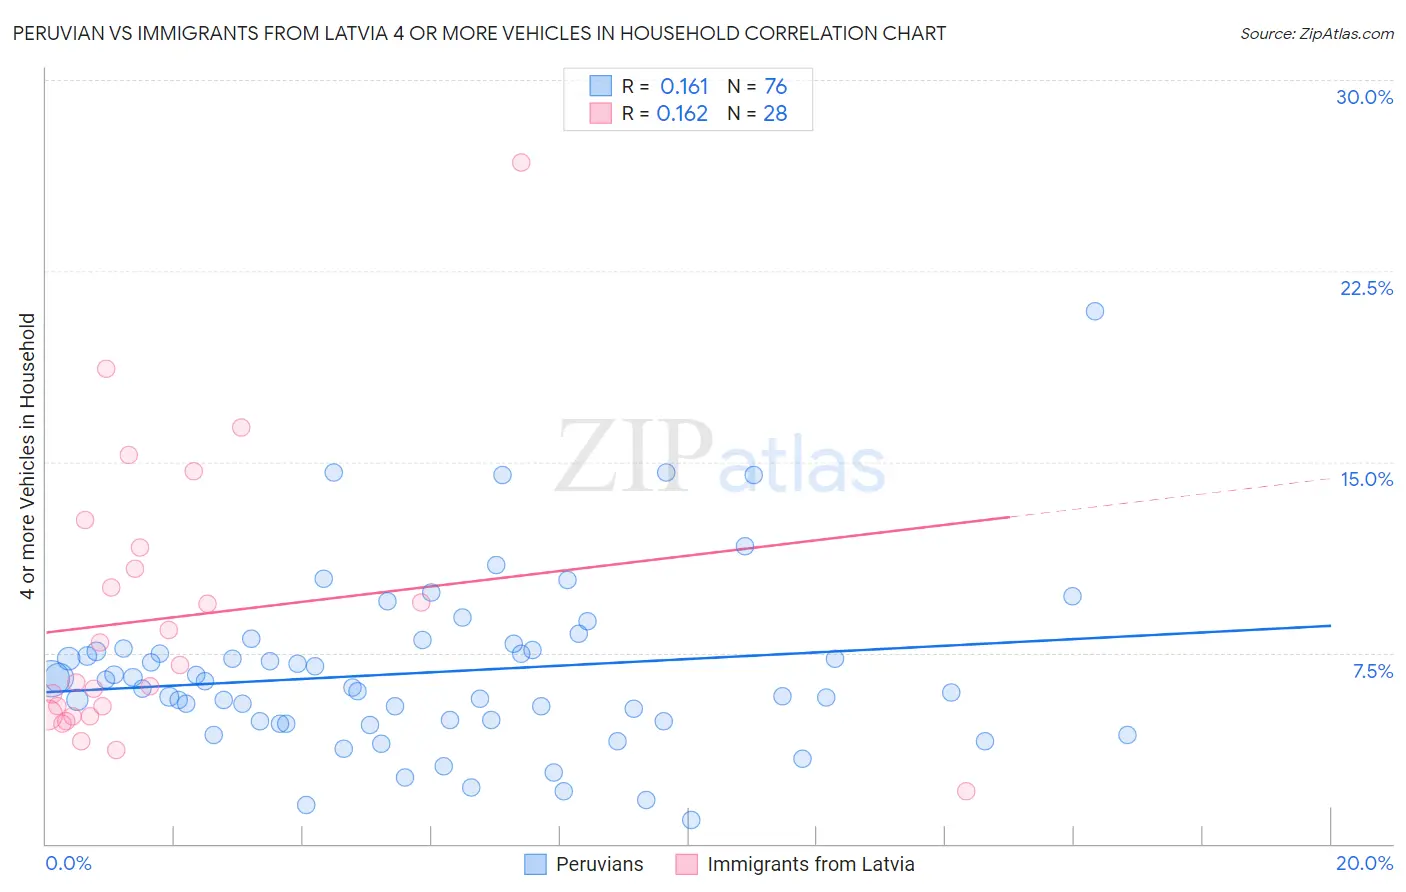
Peruvian vs Immigrants from Latvia 4 or more Vehicles in Household Correlation Chart
The statistical analysis conducted on geographies consisting of 361,410,138 people shows a poor positive correlation between the proportion of Peruvians and percentage of households with 4 or more vehicles available in the United States with a correlation coefficient (R) of 0.161 and weighted average of 6.5%. Similarly, the statistical analysis conducted on geographies consisting of 113,394,879 people shows a poor positive correlation between the proportion of Immigrants from Latvia and percentage of households with 4 or more vehicles available in the United States with a correlation coefficient (R) of 0.162 and weighted average of 5.5%, a difference of 17.6%.
4 or more Vehicles in Household Correlation Summary
| Measurement | Peruvian | Immigrants from Latvia |
| Minimum | 0.93% | 2.0% |
| Maximum | 20.9% | 26.8% |
| Range | 20.0% | 24.7% |
| Mean | 6.7% | 8.9% |
| Median | 6.3% | 6.7% |
| Interquartile 25% (IQ1) | 4.8% | 5.0% |
| Interquartile 75% (IQ3) | 7.6% | 11.2% |
| Interquartile Range (IQR) | 2.8% | 6.2% |
| Standard Deviation (Sample) | 3.3% | 5.5% |
| Standard Deviation (Population) | 3.3% | 5.4% |
Similar Demographics by 4 or more Vehicles in Household
Demographics Similar to Peruvians by 4 or more Vehicles in Household
In terms of 4 or more vehicles in household, the demographic groups most similar to Peruvians are Iranian (6.5%, a difference of 0.050%), Iroquois (6.5%, a difference of 0.11%), Central American Indian (6.5%, a difference of 0.19%), Immigrants from Armenia (6.5%, a difference of 0.21%), and Zimbabwean (6.4%, a difference of 0.27%).
| Demographics | Rating | Rank | 4 or more Vehicles in Household |
| New Zealanders | 73.3 /100 | #150 | Good 6.5% |
| Immigrants | Hong Kong | 72.2 /100 | #151 | Good 6.5% |
| Yuman | 72.1 /100 | #152 | Good 6.5% |
| Immigrants | Armenia | 71.2 /100 | #153 | Good 6.5% |
| Central American Indians | 71.1 /100 | #154 | Good 6.5% |
| Iroquois | 70.4 /100 | #155 | Good 6.5% |
| Iranians | 69.9 /100 | #156 | Good 6.5% |
| Peruvians | 69.4 /100 | #157 | Good 6.5% |
| Zimbabweans | 67.1 /100 | #158 | Good 6.4% |
| Indians (Asian) | 66.3 /100 | #159 | Good 6.4% |
| Palestinians | 65.8 /100 | #160 | Good 6.4% |
| Immigrants | Cameroon | 64.4 /100 | #161 | Good 6.4% |
| Immigrants | Pakistan | 63.2 /100 | #162 | Good 6.4% |
| Chileans | 61.2 /100 | #163 | Good 6.4% |
| Hungarians | 61.1 /100 | #164 | Good 6.4% |
Demographics Similar to Immigrants from Latvia by 4 or more Vehicles in Household
In terms of 4 or more vehicles in household, the demographic groups most similar to Immigrants from Latvia are Cambodian (5.5%, a difference of 0.010%), Immigrants from Bulgaria (5.5%, a difference of 0.12%), Black/African American (5.5%, a difference of 0.13%), Macedonian (5.5%, a difference of 0.25%), and Immigrants from Kazakhstan (5.5%, a difference of 0.28%).
| Demographics | Rating | Rank | 4 or more Vehicles in Household |
| Carpatho Rusyns | 0.7 /100 | #269 | Tragic 5.5% |
| Okinawans | 0.6 /100 | #270 | Tragic 5.5% |
| Immigrants | Sudan | 0.6 /100 | #271 | Tragic 5.5% |
| Immigrants | Kazakhstan | 0.6 /100 | #272 | Tragic 5.5% |
| Macedonians | 0.6 /100 | #273 | Tragic 5.5% |
| Blacks/African Americans | 0.6 /100 | #274 | Tragic 5.5% |
| Cambodians | 0.5 /100 | #275 | Tragic 5.5% |
| Immigrants | Latvia | 0.5 /100 | #276 | Tragic 5.5% |
| Immigrants | Bulgaria | 0.5 /100 | #277 | Tragic 5.5% |
| Immigrants | Eastern Europe | 0.4 /100 | #278 | Tragic 5.4% |
| Immigrants | Uruguay | 0.3 /100 | #279 | Tragic 5.4% |
| Alsatians | 0.3 /100 | #280 | Tragic 5.4% |
| Immigrants | Western Africa | 0.3 /100 | #281 | Tragic 5.4% |
| Immigrants | Spain | 0.3 /100 | #282 | Tragic 5.4% |
| Immigrants | Ireland | 0.3 /100 | #283 | Tragic 5.4% |