Haitian vs Immigrants from Latvia 4 or more Vehicles in Household
COMPARE
Haitian
Immigrants from Latvia
4 or more Vehicles in Household
4 or more Vehicles in Household Comparison
Haitians
Immigrants from Latvia
4.6%
4 OR MORE VEHICLES IN HOUSEHOLD
0.0/ 100
METRIC RATING
319th/ 347
METRIC RANK
5.5%
4 OR MORE VEHICLES IN HOUSEHOLD
0.5/ 100
METRIC RATING
276th/ 347
METRIC RANK
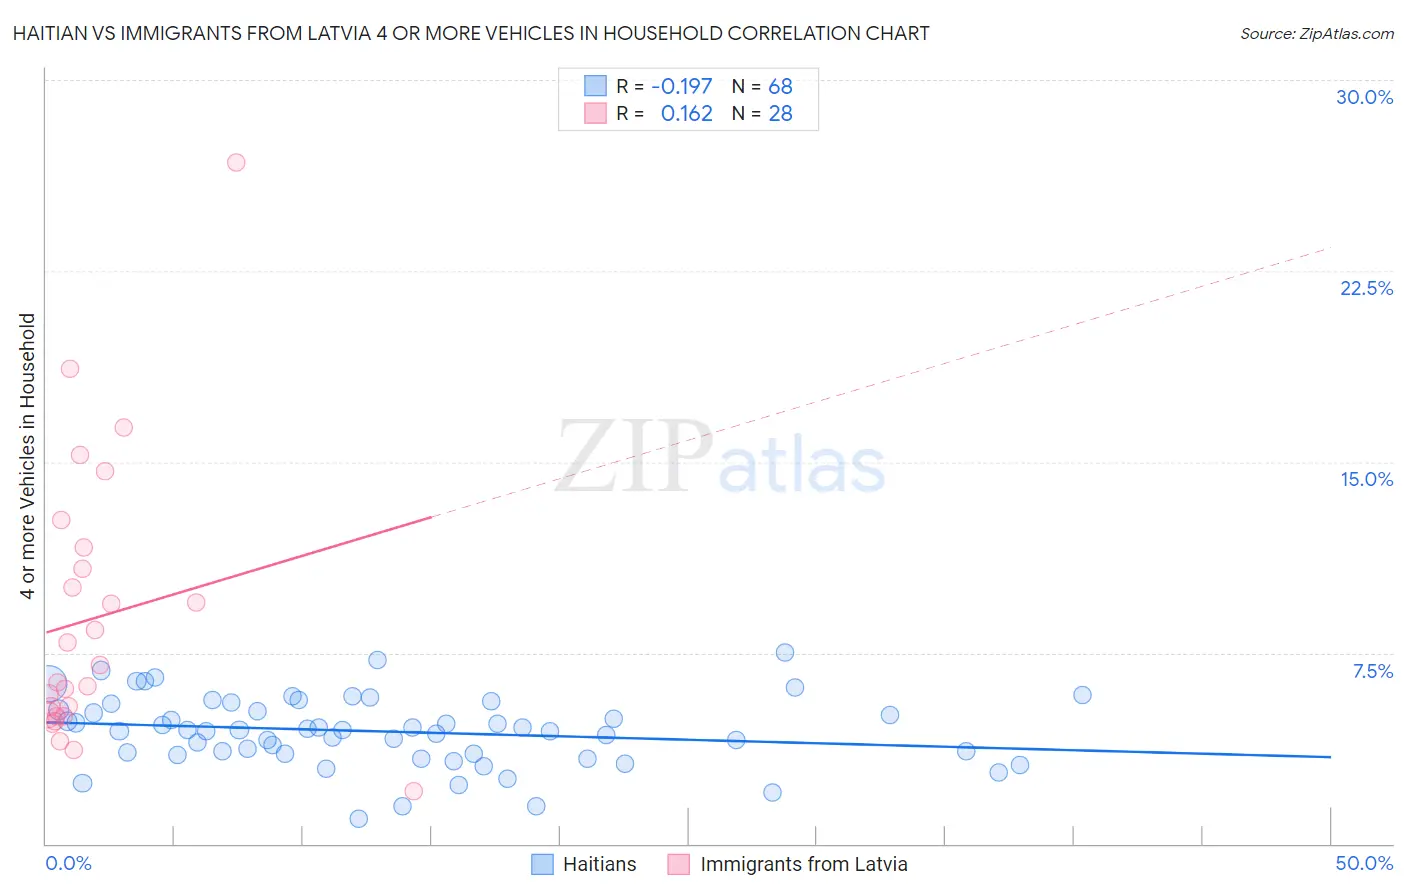
Haitian vs Immigrants from Latvia 4 or more Vehicles in Household Correlation Chart
The statistical analysis conducted on geographies consisting of 286,216,427 people shows a poor negative correlation between the proportion of Haitians and percentage of households with 4 or more vehicles available in the United States with a correlation coefficient (R) of -0.197 and weighted average of 4.6%. Similarly, the statistical analysis conducted on geographies consisting of 113,394,879 people shows a poor positive correlation between the proportion of Immigrants from Latvia and percentage of households with 4 or more vehicles available in the United States with a correlation coefficient (R) of 0.162 and weighted average of 5.5%, a difference of 19.3%.
4 or more Vehicles in Household Correlation Summary
| Measurement | Haitian | Immigrants from Latvia |
| Minimum | 0.97% | 2.0% |
| Maximum | 7.5% | 26.8% |
| Range | 6.5% | 24.7% |
| Mean | 4.4% | 8.9% |
| Median | 4.4% | 6.7% |
| Interquartile 25% (IQ1) | 3.6% | 5.0% |
| Interquartile 75% (IQ3) | 5.4% | 11.2% |
| Interquartile Range (IQR) | 1.8% | 6.2% |
| Standard Deviation (Sample) | 1.4% | 5.5% |
| Standard Deviation (Population) | 1.4% | 5.4% |
Similar Demographics by 4 or more Vehicles in Household
Demographics Similar to Haitians by 4 or more Vehicles in Household
In terms of 4 or more vehicles in household, the demographic groups most similar to Haitians are Jamaican (4.6%, a difference of 0.65%), U.S. Virgin Islander (4.6%, a difference of 0.89%), Immigrants from Haiti (4.5%, a difference of 2.3%), Puerto Rican (4.7%, a difference of 2.6%), and Immigrants from Belarus (4.7%, a difference of 3.0%).
| Demographics | Rating | Rank | 4 or more Vehicles in Household |
| Albanians | 0.0 /100 | #312 | Tragic 4.8% |
| Immigrants | Israel | 0.0 /100 | #313 | Tragic 4.8% |
| Immigrants | West Indies | 0.0 /100 | #314 | Tragic 4.7% |
| Immigrants | Belarus | 0.0 /100 | #315 | Tragic 4.7% |
| Puerto Ricans | 0.0 /100 | #316 | Tragic 4.7% |
| U.S. Virgin Islanders | 0.0 /100 | #317 | Tragic 4.6% |
| Jamaicans | 0.0 /100 | #318 | Tragic 4.6% |
| Haitians | 0.0 /100 | #319 | Tragic 4.6% |
| Immigrants | Haiti | 0.0 /100 | #320 | Tragic 4.5% |
| Ecuadorians | 0.0 /100 | #321 | Tragic 4.5% |
| Immigrants | Yemen | 0.0 /100 | #322 | Tragic 4.5% |
| Immigrants | Caribbean | 0.0 /100 | #323 | Tragic 4.4% |
| Soviet Union | 0.0 /100 | #324 | Tragic 4.4% |
| Immigrants | Jamaica | 0.0 /100 | #325 | Tragic 4.4% |
| Cape Verdeans | 0.0 /100 | #326 | Tragic 4.4% |
Demographics Similar to Immigrants from Latvia by 4 or more Vehicles in Household
In terms of 4 or more vehicles in household, the demographic groups most similar to Immigrants from Latvia are Cambodian (5.5%, a difference of 0.010%), Immigrants from Bulgaria (5.5%, a difference of 0.12%), Black/African American (5.5%, a difference of 0.13%), Macedonian (5.5%, a difference of 0.25%), and Immigrants from Kazakhstan (5.5%, a difference of 0.28%).
| Demographics | Rating | Rank | 4 or more Vehicles in Household |
| Carpatho Rusyns | 0.7 /100 | #269 | Tragic 5.5% |
| Okinawans | 0.6 /100 | #270 | Tragic 5.5% |
| Immigrants | Sudan | 0.6 /100 | #271 | Tragic 5.5% |
| Immigrants | Kazakhstan | 0.6 /100 | #272 | Tragic 5.5% |
| Macedonians | 0.6 /100 | #273 | Tragic 5.5% |
| Blacks/African Americans | 0.6 /100 | #274 | Tragic 5.5% |
| Cambodians | 0.5 /100 | #275 | Tragic 5.5% |
| Immigrants | Latvia | 0.5 /100 | #276 | Tragic 5.5% |
| Immigrants | Bulgaria | 0.5 /100 | #277 | Tragic 5.5% |
| Immigrants | Eastern Europe | 0.4 /100 | #278 | Tragic 5.4% |
| Immigrants | Uruguay | 0.3 /100 | #279 | Tragic 5.4% |
| Alsatians | 0.3 /100 | #280 | Tragic 5.4% |
| Immigrants | Western Africa | 0.3 /100 | #281 | Tragic 5.4% |
| Immigrants | Spain | 0.3 /100 | #282 | Tragic 5.4% |
| Immigrants | Ireland | 0.3 /100 | #283 | Tragic 5.4% |