Alaska Native vs Immigrants from Latvia 4 or more Vehicles in Household
COMPARE
Alaska Native
Immigrants from Latvia
4 or more Vehicles in Household
4 or more Vehicles in Household Comparison
Alaska Natives
Immigrants from Latvia
7.3%
4 OR MORE VEHICLES IN HOUSEHOLD
99.8/ 100
METRIC RATING
80th/ 347
METRIC RANK
5.5%
4 OR MORE VEHICLES IN HOUSEHOLD
0.5/ 100
METRIC RATING
276th/ 347
METRIC RANK
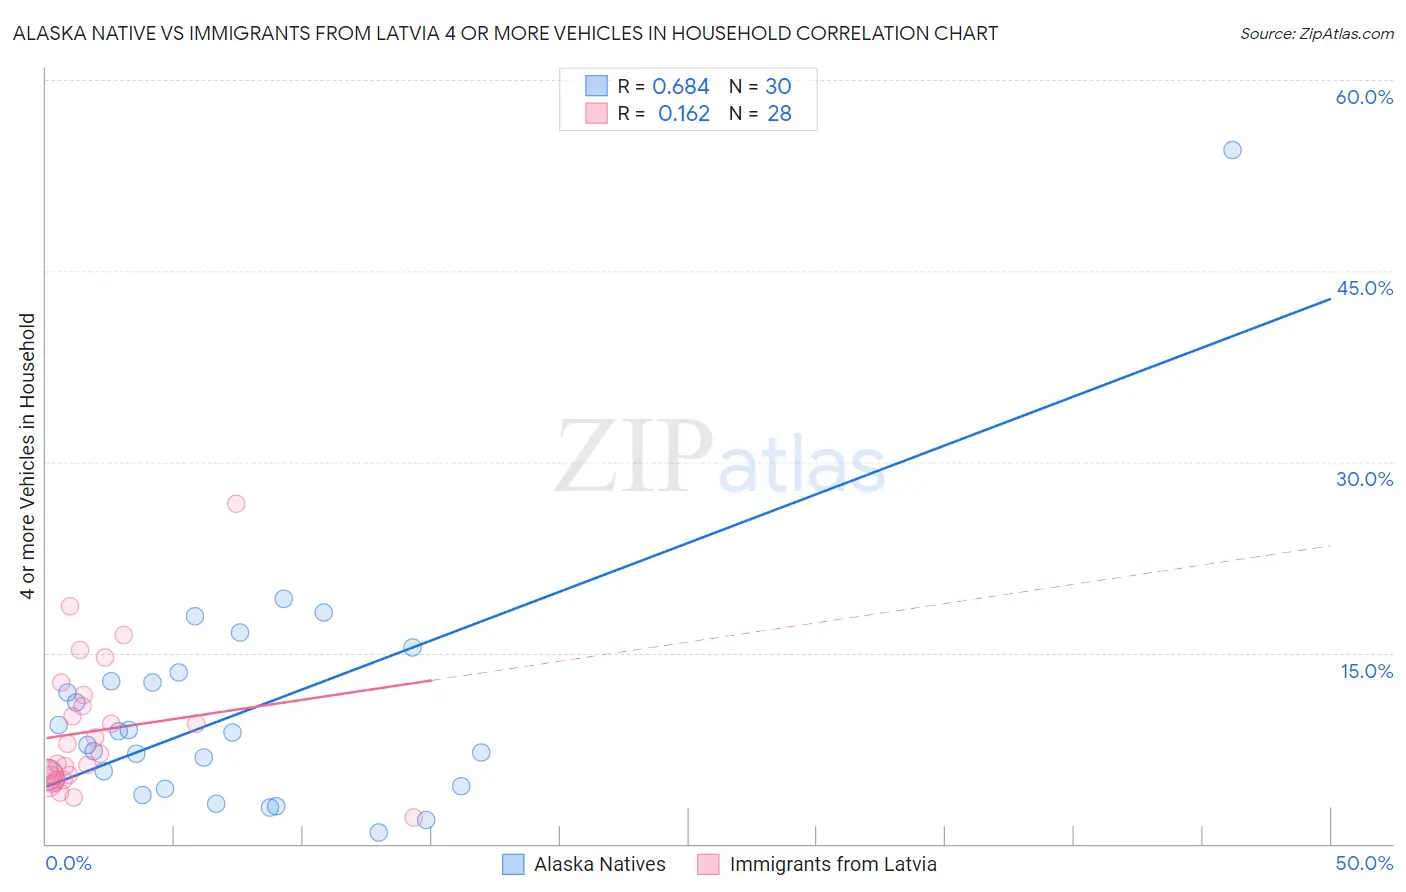
Alaska Native vs Immigrants from Latvia 4 or more Vehicles in Household Correlation Chart
The statistical analysis conducted on geographies consisting of 76,511,900 people shows a significant positive correlation between the proportion of Alaska Natives and percentage of households with 4 or more vehicles available in the United States with a correlation coefficient (R) of 0.684 and weighted average of 7.3%. Similarly, the statistical analysis conducted on geographies consisting of 113,394,879 people shows a poor positive correlation between the proportion of Immigrants from Latvia and percentage of households with 4 or more vehicles available in the United States with a correlation coefficient (R) of 0.162 and weighted average of 5.5%, a difference of 33.8%.
4 or more Vehicles in Household Correlation Summary
| Measurement | Alaska Native | Immigrants from Latvia |
| Minimum | 0.90% | 2.0% |
| Maximum | 54.5% | 26.8% |
| Range | 53.6% | 24.7% |
| Mean | 10.4% | 8.9% |
| Median | 8.3% | 6.7% |
| Interquartile 25% (IQ1) | 4.5% | 5.0% |
| Interquartile 75% (IQ3) | 12.7% | 11.2% |
| Interquartile Range (IQR) | 8.2% | 6.2% |
| Standard Deviation (Sample) | 9.8% | 5.5% |
| Standard Deviation (Population) | 9.6% | 5.4% |
Similar Demographics by 4 or more Vehicles in Household
Demographics Similar to Alaska Natives by 4 or more Vehicles in Household
In terms of 4 or more vehicles in household, the demographic groups most similar to Alaska Natives are Czech (7.4%, a difference of 0.14%), White/Caucasian (7.4%, a difference of 0.31%), Apache (7.4%, a difference of 0.38%), Laotian (7.4%, a difference of 0.54%), and Finnish (7.3%, a difference of 0.56%).
| Demographics | Rating | Rank | 4 or more Vehicles in Household |
| Portuguese | 99.9 /100 | #73 | Exceptional 7.4% |
| Icelanders | 99.9 /100 | #74 | Exceptional 7.4% |
| Immigrants | Cambodia | 99.9 /100 | #75 | Exceptional 7.4% |
| Laotians | 99.9 /100 | #76 | Exceptional 7.4% |
| Apache | 99.9 /100 | #77 | Exceptional 7.4% |
| Whites/Caucasians | 99.8 /100 | #78 | Exceptional 7.4% |
| Czechs | 99.8 /100 | #79 | Exceptional 7.4% |
| Alaska Natives | 99.8 /100 | #80 | Exceptional 7.3% |
| Finns | 99.8 /100 | #81 | Exceptional 7.3% |
| Northern Europeans | 99.8 /100 | #82 | Exceptional 7.3% |
| Potawatomi | 99.7 /100 | #83 | Exceptional 7.3% |
| Afghans | 99.7 /100 | #84 | Exceptional 7.3% |
| Cree | 99.7 /100 | #85 | Exceptional 7.2% |
| Immigrants | Indonesia | 99.6 /100 | #86 | Exceptional 7.2% |
| Delaware | 99.6 /100 | #87 | Exceptional 7.2% |
Demographics Similar to Immigrants from Latvia by 4 or more Vehicles in Household
In terms of 4 or more vehicles in household, the demographic groups most similar to Immigrants from Latvia are Cambodian (5.5%, a difference of 0.010%), Immigrants from Bulgaria (5.5%, a difference of 0.12%), Black/African American (5.5%, a difference of 0.13%), Macedonian (5.5%, a difference of 0.25%), and Immigrants from Kazakhstan (5.5%, a difference of 0.28%).
| Demographics | Rating | Rank | 4 or more Vehicles in Household |
| Carpatho Rusyns | 0.7 /100 | #269 | Tragic 5.5% |
| Okinawans | 0.6 /100 | #270 | Tragic 5.5% |
| Immigrants | Sudan | 0.6 /100 | #271 | Tragic 5.5% |
| Immigrants | Kazakhstan | 0.6 /100 | #272 | Tragic 5.5% |
| Macedonians | 0.6 /100 | #273 | Tragic 5.5% |
| Blacks/African Americans | 0.6 /100 | #274 | Tragic 5.5% |
| Cambodians | 0.5 /100 | #275 | Tragic 5.5% |
| Immigrants | Latvia | 0.5 /100 | #276 | Tragic 5.5% |
| Immigrants | Bulgaria | 0.5 /100 | #277 | Tragic 5.5% |
| Immigrants | Eastern Europe | 0.4 /100 | #278 | Tragic 5.4% |
| Immigrants | Uruguay | 0.3 /100 | #279 | Tragic 5.4% |
| Alsatians | 0.3 /100 | #280 | Tragic 5.4% |
| Immigrants | Western Africa | 0.3 /100 | #281 | Tragic 5.4% |
| Immigrants | Spain | 0.3 /100 | #282 | Tragic 5.4% |
| Immigrants | Ireland | 0.3 /100 | #283 | Tragic 5.4% |