English vs Immigrants from Latvia Family Households
COMPARE
English
Immigrants from Latvia
Family Households
Family Households Comparison
English
Immigrants from Latvia
65.1%
FAMILY HOUSEHOLDS
97.4/ 100
METRIC RATING
105th/ 347
METRIC RANK
62.0%
FAMILY HOUSEHOLDS
0.0/ 100
METRIC RATING
312th/ 347
METRIC RANK
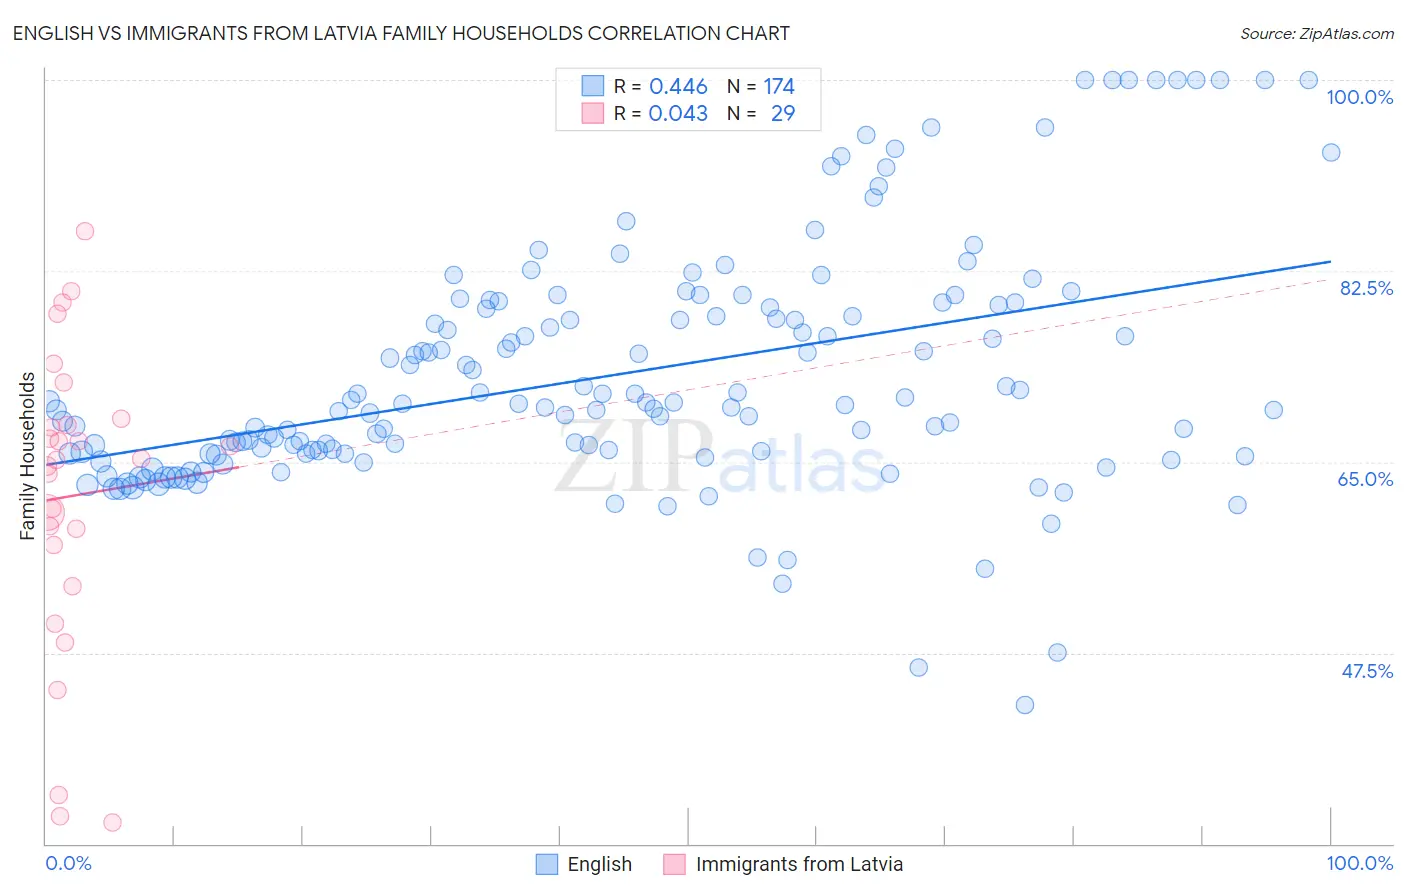
English vs Immigrants from Latvia Family Households Correlation Chart
The statistical analysis conducted on geographies consisting of 579,316,298 people shows a moderate positive correlation between the proportion of English and percentage of family households in the United States with a correlation coefficient (R) of 0.446 and weighted average of 65.1%. Similarly, the statistical analysis conducted on geographies consisting of 113,726,313 people shows no correlation between the proportion of Immigrants from Latvia and percentage of family households in the United States with a correlation coefficient (R) of 0.043 and weighted average of 62.0%, a difference of 5.0%.
Family Households Correlation Summary
| Measurement | English | Immigrants from Latvia |
| Minimum | 42.7% | 31.9% |
| Maximum | 100.0% | 86.2% |
| Range | 57.3% | 54.2% |
| Mean | 73.0% | 61.9% |
| Median | 70.3% | 65.2% |
| Interquartile 25% (IQ1) | 65.8% | 55.5% |
| Interquartile 75% (IQ3) | 79.2% | 68.7% |
| Interquartile Range (IQR) | 13.5% | 13.2% |
| Standard Deviation (Sample) | 11.1% | 13.8% |
| Standard Deviation (Population) | 11.0% | 13.5% |
Similar Demographics by Family Households
Demographics Similar to English by Family Households
In terms of family households, the demographic groups most similar to English are White/Caucasian (65.1%, a difference of 0.010%), Alaska Native (65.1%, a difference of 0.010%), Palestinian (65.1%, a difference of 0.020%), Immigrants from Guatemala (65.0%, a difference of 0.060%), and Indian (Asian) (65.1%, a difference of 0.070%).
| Demographics | Rating | Rank | Family Households |
| Immigrants | Syria | 98.4 /100 | #98 | Exceptional 65.2% |
| Central American Indians | 98.3 /100 | #99 | Exceptional 65.2% |
| Haitians | 98.1 /100 | #100 | Exceptional 65.2% |
| Chileans | 98.1 /100 | #101 | Exceptional 65.2% |
| Immigrants | Sri Lanka | 98.0 /100 | #102 | Exceptional 65.1% |
| Indians (Asian) | 97.9 /100 | #103 | Exceptional 65.1% |
| Spaniards | 97.8 /100 | #104 | Exceptional 65.1% |
| English | 97.4 /100 | #105 | Exceptional 65.1% |
| Whites/Caucasians | 97.3 /100 | #106 | Exceptional 65.1% |
| Alaska Natives | 97.3 /100 | #107 | Exceptional 65.1% |
| Palestinians | 97.2 /100 | #108 | Exceptional 65.1% |
| Immigrants | Guatemala | 96.9 /100 | #109 | Exceptional 65.0% |
| Scandinavians | 96.8 /100 | #110 | Exceptional 65.0% |
| Europeans | 96.8 /100 | #111 | Exceptional 65.0% |
| Immigrants | Jordan | 96.5 /100 | #112 | Exceptional 65.0% |
Demographics Similar to Immigrants from Latvia by Family Households
In terms of family households, the demographic groups most similar to Immigrants from Latvia are Liberian (62.0%, a difference of 0.010%), Immigrants from Morocco (62.0%, a difference of 0.050%), Immigrants from Cabo Verde (61.9%, a difference of 0.060%), Immigrants from Liberia (62.0%, a difference of 0.080%), and Moroccan (61.9%, a difference of 0.10%).
| Demographics | Rating | Rank | Family Households |
| Bermudans | 0.0 /100 | #305 | Tragic 62.2% |
| Africans | 0.0 /100 | #306 | Tragic 62.1% |
| Immigrants | Norway | 0.0 /100 | #307 | Tragic 62.1% |
| Chippewa | 0.0 /100 | #308 | Tragic 62.1% |
| Sub-Saharan Africans | 0.0 /100 | #309 | Tragic 62.1% |
| Immigrants | Liberia | 0.0 /100 | #310 | Tragic 62.0% |
| Immigrants | Morocco | 0.0 /100 | #311 | Tragic 62.0% |
| Immigrants | Latvia | 0.0 /100 | #312 | Tragic 62.0% |
| Liberians | 0.0 /100 | #313 | Tragic 62.0% |
| Immigrants | Cabo Verde | 0.0 /100 | #314 | Tragic 61.9% |
| Moroccans | 0.0 /100 | #315 | Tragic 61.9% |
| Immigrants | Middle Africa | 0.0 /100 | #316 | Tragic 61.9% |
| Immigrants | Bosnia and Herzegovina | 0.0 /100 | #317 | Tragic 61.9% |
| Alaskan Athabascans | 0.0 /100 | #318 | Tragic 61.8% |
| Cape Verdeans | 0.0 /100 | #319 | Tragic 61.8% |