Delaware vs Immigrants from Taiwan 3 or more Vehicles in Household
COMPARE
Delaware
Immigrants from Taiwan
3 or more Vehicles in Household
3 or more Vehicles in Household Comparison
Delaware
Immigrants from Taiwan
21.5%
3 OR MORE VEHICLES IN HOUSEHOLD
99.6/ 100
METRIC RATING
86th/ 347
METRIC RANK
22.1%
3 OR MORE VEHICLES IN HOUSEHOLD
99.9/ 100
METRIC RATING
64th/ 347
METRIC RANK
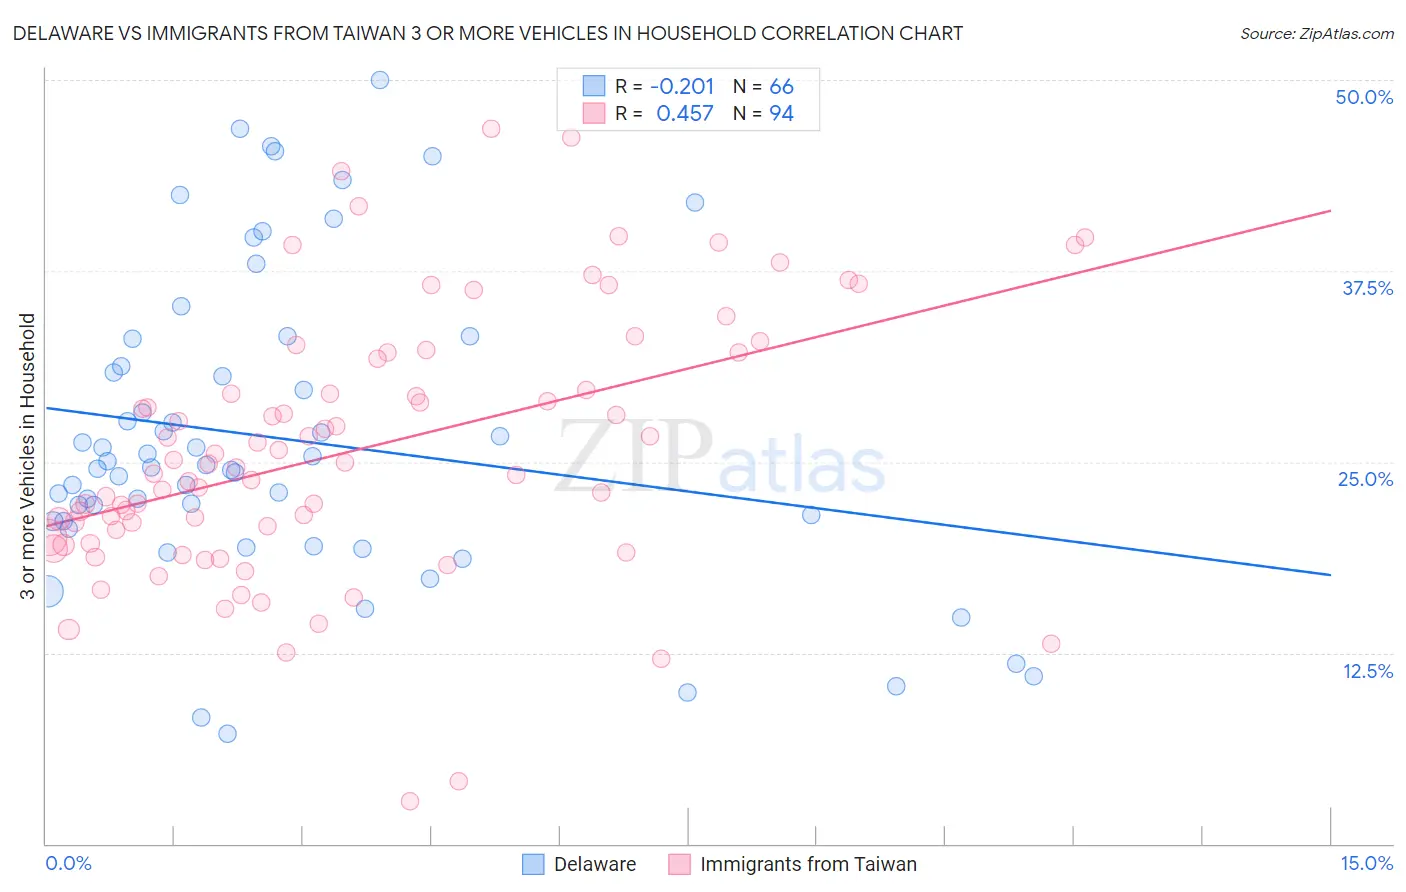
Delaware vs Immigrants from Taiwan 3 or more Vehicles in Household Correlation Chart
The statistical analysis conducted on geographies consisting of 96,224,171 people shows a weak negative correlation between the proportion of Delaware and percentage of households with 3 or more vehicles available in the United States with a correlation coefficient (R) of -0.201 and weighted average of 21.5%. Similarly, the statistical analysis conducted on geographies consisting of 298,037,283 people shows a moderate positive correlation between the proportion of Immigrants from Taiwan and percentage of households with 3 or more vehicles available in the United States with a correlation coefficient (R) of 0.457 and weighted average of 22.1%, a difference of 3.0%.
3 or more Vehicles in Household Correlation Summary
| Measurement | Delaware | Immigrants from Taiwan |
| Minimum | 7.2% | 2.7% |
| Maximum | 50.0% | 46.8% |
| Range | 42.8% | 44.0% |
| Mean | 26.5% | 25.8% |
| Median | 24.7% | 24.8% |
| Interquartile 25% (IQ1) | 21.1% | 20.1% |
| Interquartile 75% (IQ3) | 31.3% | 31.7% |
| Interquartile Range (IQR) | 10.1% | 11.6% |
| Standard Deviation (Sample) | 10.0% | 8.6% |
| Standard Deviation (Population) | 9.9% | 8.6% |
Similar Demographics by 3 or more Vehicles in Household
Demographics Similar to Delaware by 3 or more Vehicles in Household
In terms of 3 or more vehicles in household, the demographic groups most similar to Delaware are Laotian (21.5%, a difference of 0.080%), Icelander (21.5%, a difference of 0.090%), Immigrants from the Azores (21.5%, a difference of 0.12%), Chippewa (21.5%, a difference of 0.14%), and Immigrants from El Salvador (21.5%, a difference of 0.17%).
| Demographics | Rating | Rank | 3 or more Vehicles in Household |
| Assyrians/Chaldeans/Syriacs | 99.8 /100 | #79 | Exceptional 21.7% |
| Afghans | 99.7 /100 | #80 | Exceptional 21.7% |
| Celtics | 99.7 /100 | #81 | Exceptional 21.7% |
| Immigrants | El Salvador | 99.6 /100 | #82 | Exceptional 21.5% |
| Chippewa | 99.6 /100 | #83 | Exceptional 21.5% |
| Icelanders | 99.6 /100 | #84 | Exceptional 21.5% |
| Laotians | 99.6 /100 | #85 | Exceptional 21.5% |
| Delaware | 99.6 /100 | #86 | Exceptional 21.5% |
| Immigrants | Azores | 99.5 /100 | #87 | Exceptional 21.5% |
| French | 99.4 /100 | #88 | Exceptional 21.4% |
| Marshallese | 99.2 /100 | #89 | Exceptional 21.3% |
| Immigrants | Afghanistan | 99.1 /100 | #90 | Exceptional 21.2% |
| Belgians | 98.9 /100 | #91 | Exceptional 21.2% |
| Apache | 98.9 /100 | #92 | Exceptional 21.2% |
| Immigrants | Indonesia | 98.8 /100 | #93 | Exceptional 21.1% |
Demographics Similar to Immigrants from Taiwan by 3 or more Vehicles in Household
In terms of 3 or more vehicles in household, the demographic groups most similar to Immigrants from Taiwan are Chickasaw (22.2%, a difference of 0.33%), Pima (22.0%, a difference of 0.42%), Fijian (22.2%, a difference of 0.49%), Bhutanese (22.2%, a difference of 0.54%), and Northern European (22.0%, a difference of 0.56%).
| Demographics | Rating | Rank | 3 or more Vehicles in Household |
| Pennsylvania Germans | 100.0 /100 | #57 | Exceptional 22.3% |
| Spaniards | 100.0 /100 | #58 | Exceptional 22.3% |
| Navajo | 100.0 /100 | #59 | Exceptional 22.3% |
| Finns | 99.9 /100 | #60 | Exceptional 22.3% |
| Bhutanese | 99.9 /100 | #61 | Exceptional 22.2% |
| Fijians | 99.9 /100 | #62 | Exceptional 22.2% |
| Chickasaw | 99.9 /100 | #63 | Exceptional 22.2% |
| Immigrants | Taiwan | 99.9 /100 | #64 | Exceptional 22.1% |
| Pima | 99.9 /100 | #65 | Exceptional 22.0% |
| Northern Europeans | 99.9 /100 | #66 | Exceptional 22.0% |
| Alaskan Athabascans | 99.9 /100 | #67 | Exceptional 21.9% |
| British | 99.9 /100 | #68 | Exceptional 21.9% |
| Creek | 99.9 /100 | #69 | Exceptional 21.9% |
| Bangladeshis | 99.8 /100 | #70 | Exceptional 21.9% |
| Potawatomi | 99.8 /100 | #71 | Exceptional 21.9% |