Czech vs Immigrants from Chile 4 or more Vehicles in Household
COMPARE
Czech
Immigrants from Chile
4 or more Vehicles in Household
4 or more Vehicles in Household Comparison
Czechs
Immigrants from Chile
7.4%
4 OR MORE VEHICLES IN HOUSEHOLD
99.8/ 100
METRIC RATING
79th/ 347
METRIC RANK
6.1%
4 OR MORE VEHICLES IN HOUSEHOLD
16.9/ 100
METRIC RATING
207th/ 347
METRIC RANK
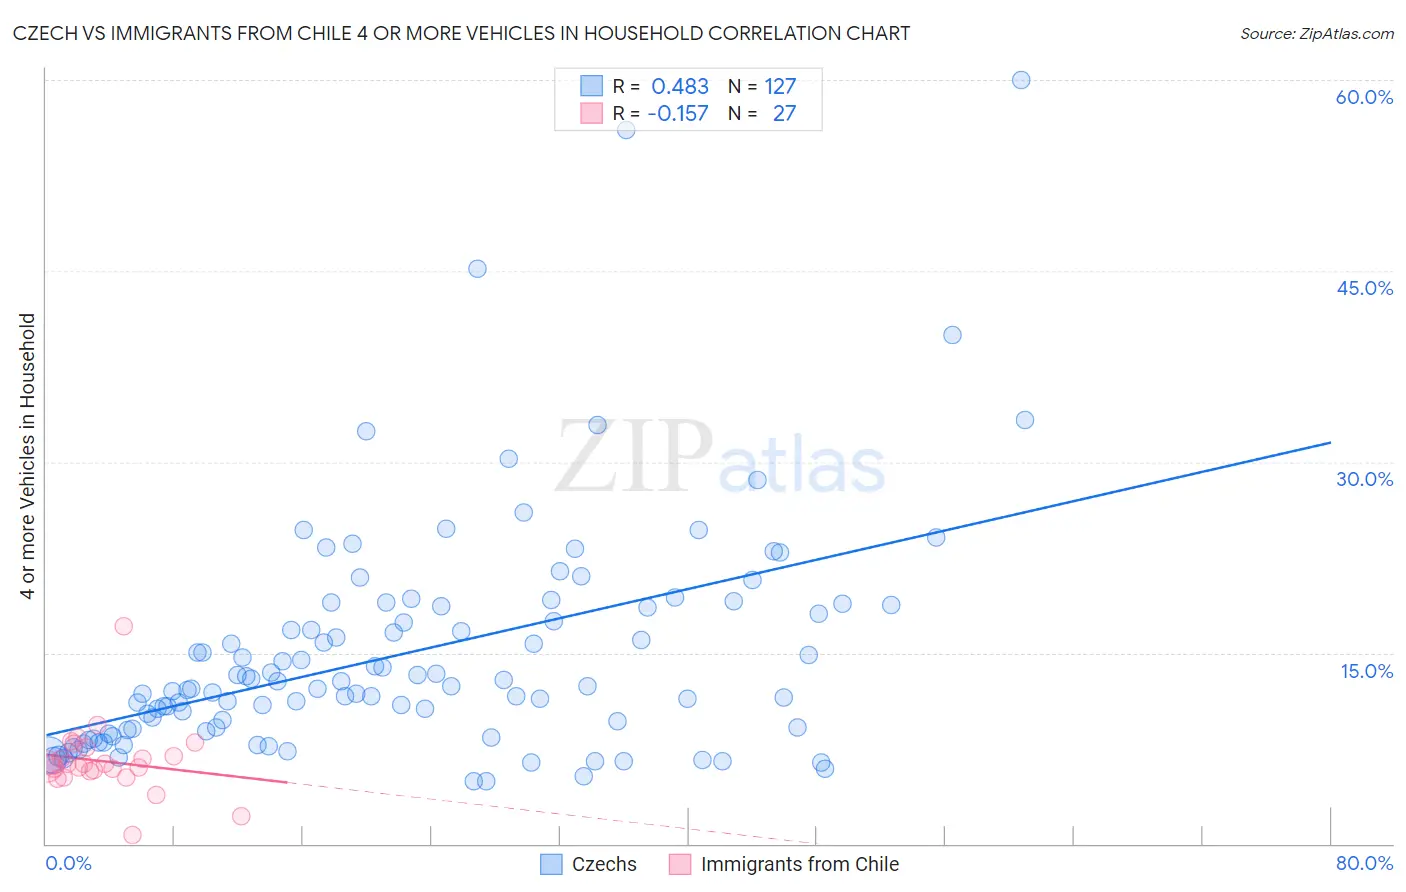
Czech vs Immigrants from Chile 4 or more Vehicles in Household Correlation Chart
The statistical analysis conducted on geographies consisting of 482,666,265 people shows a moderate positive correlation between the proportion of Czechs and percentage of households with 4 or more vehicles available in the United States with a correlation coefficient (R) of 0.483 and weighted average of 7.4%. Similarly, the statistical analysis conducted on geographies consisting of 217,712,613 people shows a poor negative correlation between the proportion of Immigrants from Chile and percentage of households with 4 or more vehicles available in the United States with a correlation coefficient (R) of -0.157 and weighted average of 6.1%, a difference of 21.1%.
4 or more Vehicles in Household Correlation Summary
| Measurement | Czech | Immigrants from Chile |
| Minimum | 4.9% | 0.72% |
| Maximum | 60.0% | 17.1% |
| Range | 55.1% | 16.4% |
| Mean | 14.9% | 6.5% |
| Median | 12.3% | 6.1% |
| Interquartile 25% (IQ1) | 8.9% | 5.7% |
| Interquartile 75% (IQ3) | 18.6% | 7.6% |
| Interquartile Range (IQR) | 9.8% | 1.9% |
| Standard Deviation (Sample) | 9.1% | 2.8% |
| Standard Deviation (Population) | 9.0% | 2.7% |
Similar Demographics by 4 or more Vehicles in Household
Demographics Similar to Czechs by 4 or more Vehicles in Household
In terms of 4 or more vehicles in household, the demographic groups most similar to Czechs are Alaska Native (7.3%, a difference of 0.14%), White/Caucasian (7.4%, a difference of 0.17%), Apache (7.4%, a difference of 0.24%), Laotian (7.4%, a difference of 0.41%), and Icelander (7.4%, a difference of 0.46%).
| Demographics | Rating | Rank | 4 or more Vehicles in Household |
| Scotch-Irish | 99.9 /100 | #72 | Exceptional 7.4% |
| Portuguese | 99.9 /100 | #73 | Exceptional 7.4% |
| Icelanders | 99.9 /100 | #74 | Exceptional 7.4% |
| Immigrants | Cambodia | 99.9 /100 | #75 | Exceptional 7.4% |
| Laotians | 99.9 /100 | #76 | Exceptional 7.4% |
| Apache | 99.9 /100 | #77 | Exceptional 7.4% |
| Whites/Caucasians | 99.8 /100 | #78 | Exceptional 7.4% |
| Czechs | 99.8 /100 | #79 | Exceptional 7.4% |
| Alaska Natives | 99.8 /100 | #80 | Exceptional 7.3% |
| Finns | 99.8 /100 | #81 | Exceptional 7.3% |
| Northern Europeans | 99.8 /100 | #82 | Exceptional 7.3% |
| Potawatomi | 99.7 /100 | #83 | Exceptional 7.3% |
| Afghans | 99.7 /100 | #84 | Exceptional 7.3% |
| Cree | 99.7 /100 | #85 | Exceptional 7.2% |
| Immigrants | Indonesia | 99.6 /100 | #86 | Exceptional 7.2% |
Demographics Similar to Immigrants from Chile by 4 or more Vehicles in Household
In terms of 4 or more vehicles in household, the demographic groups most similar to Immigrants from Chile are Immigrants from Nigeria (6.1%, a difference of 0.27%), Kenyan (6.1%, a difference of 0.28%), Immigrants from Honduras (6.1%, a difference of 0.30%), Immigrants from Zimbabwe (6.0%, a difference of 0.35%), and Honduran (6.1%, a difference of 0.42%).
| Demographics | Rating | Rank | 4 or more Vehicles in Household |
| Latvians | 21.7 /100 | #200 | Fair 6.1% |
| Egyptians | 21.4 /100 | #201 | Fair 6.1% |
| Immigrants | South Central Asia | 21.3 /100 | #202 | Fair 6.1% |
| Immigrants | Sierra Leone | 20.5 /100 | #203 | Fair 6.1% |
| Immigrants | Belize | 19.8 /100 | #204 | Poor 6.1% |
| Hondurans | 19.3 /100 | #205 | Poor 6.1% |
| Kenyans | 18.5 /100 | #206 | Poor 6.1% |
| Immigrants | Chile | 16.9 /100 | #207 | Poor 6.1% |
| Immigrants | Nigeria | 15.6 /100 | #208 | Poor 6.1% |
| Immigrants | Honduras | 15.4 /100 | #209 | Poor 6.1% |
| Immigrants | Zimbabwe | 15.1 /100 | #210 | Poor 6.0% |
| Panamanians | 14.8 /100 | #211 | Poor 6.0% |
| Immigrants | Egypt | 14.7 /100 | #212 | Poor 6.0% |
| Arabs | 14.4 /100 | #213 | Poor 6.0% |
| Immigrants | Austria | 14.3 /100 | #214 | Poor 6.0% |