Czech vs Inupiat 4 or more Vehicles in Household
COMPARE
Czech
Inupiat
4 or more Vehicles in Household
4 or more Vehicles in Household Comparison
Czechs
Inupiat
7.4%
4 OR MORE VEHICLES IN HOUSEHOLD
99.8/ 100
METRIC RATING
79th/ 347
METRIC RANK
6.2%
4 OR MORE VEHICLES IN HOUSEHOLD
30.7/ 100
METRIC RATING
191st/ 347
METRIC RANK
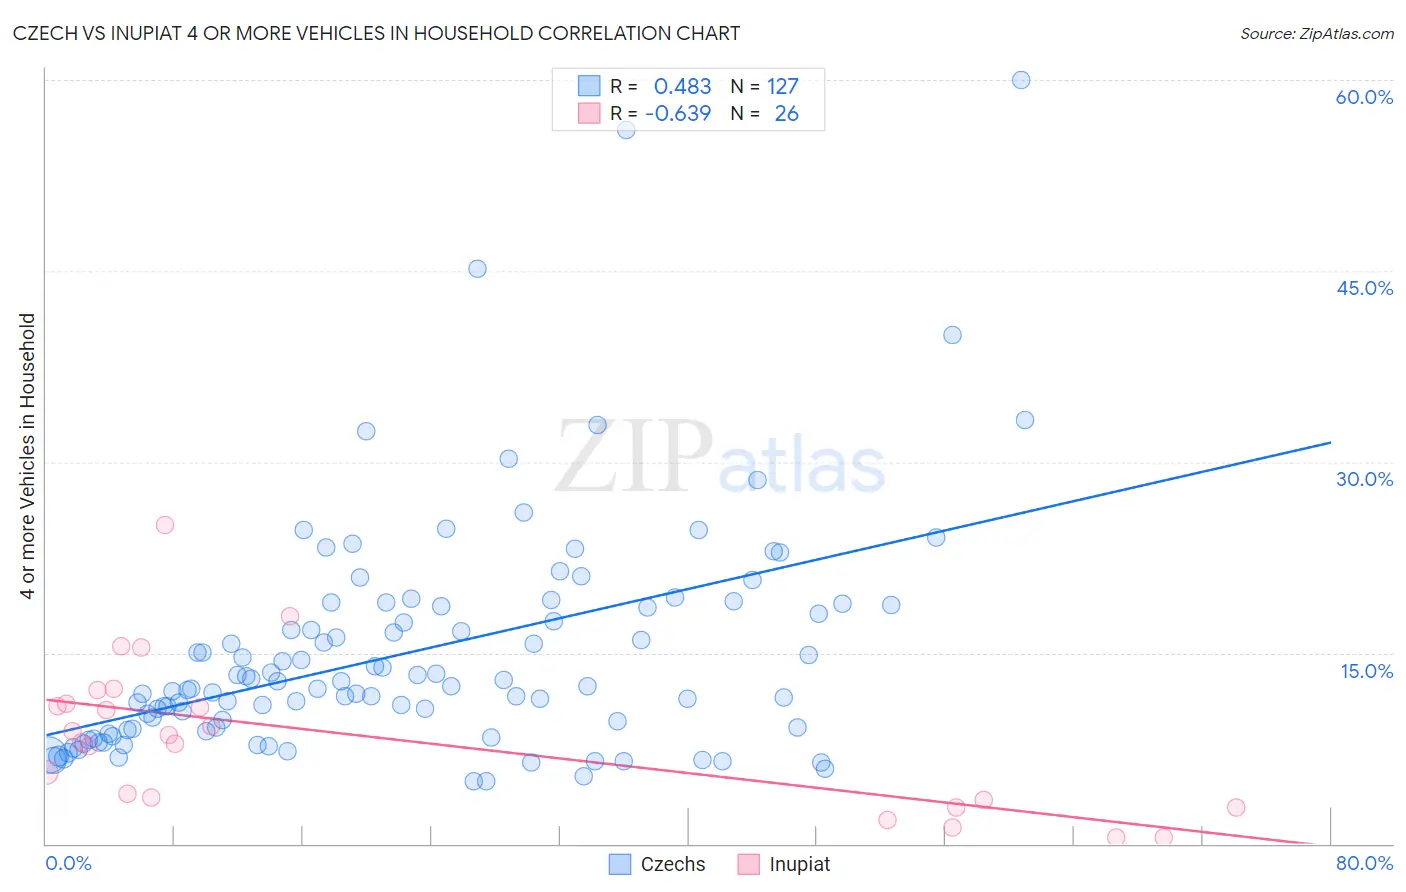
Czech vs Inupiat 4 or more Vehicles in Household Correlation Chart
The statistical analysis conducted on geographies consisting of 482,666,265 people shows a moderate positive correlation between the proportion of Czechs and percentage of households with 4 or more vehicles available in the United States with a correlation coefficient (R) of 0.483 and weighted average of 7.4%. Similarly, the statistical analysis conducted on geographies consisting of 96,224,562 people shows a significant negative correlation between the proportion of Inupiat and percentage of households with 4 or more vehicles available in the United States with a correlation coefficient (R) of -0.639 and weighted average of 6.2%, a difference of 18.6%.
4 or more Vehicles in Household Correlation Summary
| Measurement | Czech | Inupiat |
| Minimum | 4.9% | 0.47% |
| Maximum | 60.0% | 25.0% |
| Range | 55.1% | 24.5% |
| Mean | 14.9% | 8.4% |
| Median | 12.3% | 8.3% |
| Interquartile 25% (IQ1) | 8.9% | 3.4% |
| Interquartile 75% (IQ3) | 18.6% | 11.0% |
| Interquartile Range (IQR) | 9.8% | 7.5% |
| Standard Deviation (Sample) | 9.1% | 5.9% |
| Standard Deviation (Population) | 9.0% | 5.8% |
Similar Demographics by 4 or more Vehicles in Household
Demographics Similar to Czechs by 4 or more Vehicles in Household
In terms of 4 or more vehicles in household, the demographic groups most similar to Czechs are Alaska Native (7.3%, a difference of 0.14%), White/Caucasian (7.4%, a difference of 0.17%), Apache (7.4%, a difference of 0.24%), Laotian (7.4%, a difference of 0.41%), and Icelander (7.4%, a difference of 0.46%).
| Demographics | Rating | Rank | 4 or more Vehicles in Household |
| Scotch-Irish | 99.9 /100 | #72 | Exceptional 7.4% |
| Portuguese | 99.9 /100 | #73 | Exceptional 7.4% |
| Icelanders | 99.9 /100 | #74 | Exceptional 7.4% |
| Immigrants | Cambodia | 99.9 /100 | #75 | Exceptional 7.4% |
| Laotians | 99.9 /100 | #76 | Exceptional 7.4% |
| Apache | 99.9 /100 | #77 | Exceptional 7.4% |
| Whites/Caucasians | 99.8 /100 | #78 | Exceptional 7.4% |
| Czechs | 99.8 /100 | #79 | Exceptional 7.4% |
| Alaska Natives | 99.8 /100 | #80 | Exceptional 7.3% |
| Finns | 99.8 /100 | #81 | Exceptional 7.3% |
| Northern Europeans | 99.8 /100 | #82 | Exceptional 7.3% |
| Potawatomi | 99.7 /100 | #83 | Exceptional 7.3% |
| Afghans | 99.7 /100 | #84 | Exceptional 7.3% |
| Cree | 99.7 /100 | #85 | Exceptional 7.2% |
| Immigrants | Indonesia | 99.6 /100 | #86 | Exceptional 7.2% |
Demographics Similar to Inupiat by 4 or more Vehicles in Household
In terms of 4 or more vehicles in household, the demographic groups most similar to Inupiat are Romanian (6.2%, a difference of 0.010%), South African (6.2%, a difference of 0.18%), Immigrants from Eastern Asia (6.2%, a difference of 0.30%), Immigrants from Kuwait (6.2%, a difference of 0.35%), and Kiowa (6.2%, a difference of 0.47%).
| Demographics | Rating | Rank | 4 or more Vehicles in Household |
| Iraqis | 37.3 /100 | #184 | Fair 6.2% |
| Thais | 36.9 /100 | #185 | Fair 6.2% |
| Immigrants | Northern Europe | 36.8 /100 | #186 | Fair 6.2% |
| Immigrants | South Africa | 35.4 /100 | #187 | Fair 6.2% |
| Kiowa | 34.7 /100 | #188 | Fair 6.2% |
| Immigrants | Eastern Asia | 33.3 /100 | #189 | Fair 6.2% |
| South Africans | 32.2 /100 | #190 | Fair 6.2% |
| Inupiat | 30.7 /100 | #191 | Fair 6.2% |
| Romanians | 30.7 /100 | #192 | Fair 6.2% |
| Immigrants | Kuwait | 28.0 /100 | #193 | Fair 6.2% |
| Immigrants | Sweden | 27.0 /100 | #194 | Fair 6.2% |
| Argentineans | 27.0 /100 | #195 | Fair 6.2% |
| Tsimshian | 26.4 /100 | #196 | Fair 6.2% |
| Immigrants | Sri Lanka | 23.7 /100 | #197 | Fair 6.1% |
| Immigrants | Portugal | 22.3 /100 | #198 | Fair 6.1% |