South American vs Immigrants from Chile 4 or more Vehicles in Household
COMPARE
South American
Immigrants from Chile
4 or more Vehicles in Household
4 or more Vehicles in Household Comparison
South Americans
Immigrants from Chile
5.6%
4 OR MORE VEHICLES IN HOUSEHOLD
0.9/ 100
METRIC RATING
265th/ 347
METRIC RANK
6.1%
4 OR MORE VEHICLES IN HOUSEHOLD
16.9/ 100
METRIC RATING
207th/ 347
METRIC RANK
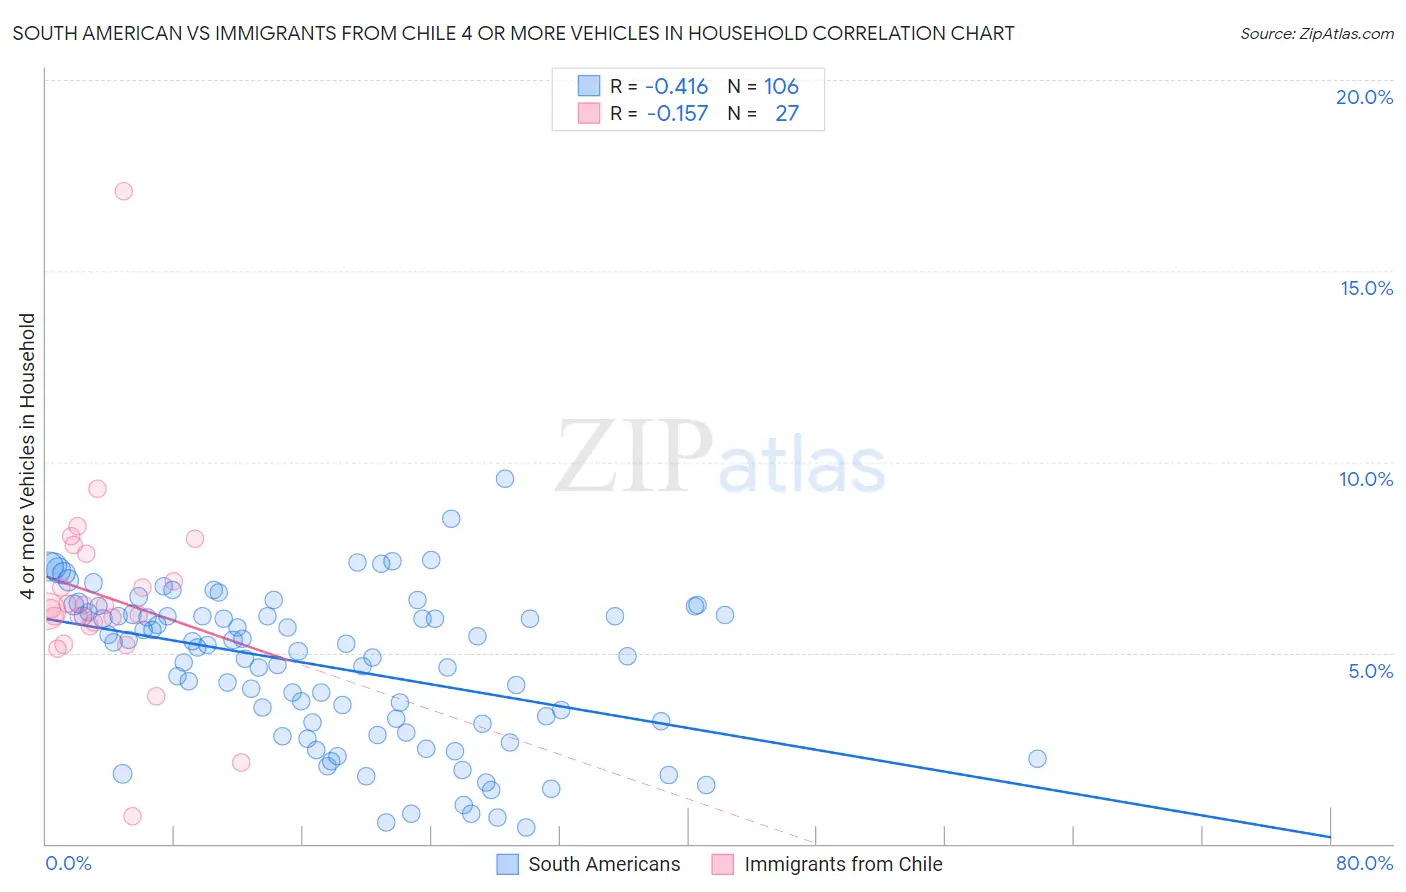
South American vs Immigrants from Chile 4 or more Vehicles in Household Correlation Chart
The statistical analysis conducted on geographies consisting of 491,409,922 people shows a moderate negative correlation between the proportion of South Americans and percentage of households with 4 or more vehicles available in the United States with a correlation coefficient (R) of -0.416 and weighted average of 5.6%. Similarly, the statistical analysis conducted on geographies consisting of 217,712,613 people shows a poor negative correlation between the proportion of Immigrants from Chile and percentage of households with 4 or more vehicles available in the United States with a correlation coefficient (R) of -0.157 and weighted average of 6.1%, a difference of 9.0%.
4 or more Vehicles in Household Correlation Summary
| Measurement | South American | Immigrants from Chile |
| Minimum | 0.44% | 0.72% |
| Maximum | 9.6% | 17.1% |
| Range | 9.1% | 16.4% |
| Mean | 4.6% | 6.5% |
| Median | 5.2% | 6.1% |
| Interquartile 25% (IQ1) | 3.2% | 5.7% |
| Interquartile 75% (IQ3) | 6.0% | 7.6% |
| Interquartile Range (IQR) | 2.8% | 1.9% |
| Standard Deviation (Sample) | 2.0% | 2.8% |
| Standard Deviation (Population) | 2.0% | 2.7% |
Similar Demographics by 4 or more Vehicles in Household
Demographics Similar to South Americans by 4 or more Vehicles in Household
In terms of 4 or more vehicles in household, the demographic groups most similar to South Americans are Immigrants from Nepal (5.6%, a difference of 0.020%), Immigrants from Ukraine (5.6%, a difference of 0.11%), Immigrants from Africa (5.6%, a difference of 0.22%), Colombian (5.5%, a difference of 0.54%), and Carpatho Rusyn (5.5%, a difference of 0.69%).
| Demographics | Rating | Rank | 4 or more Vehicles in Household |
| Immigrants | Lithuania | 1.4 /100 | #258 | Tragic 5.6% |
| Immigrants | France | 1.3 /100 | #259 | Tragic 5.6% |
| Uruguayans | 1.3 /100 | #260 | Tragic 5.6% |
| Sudanese | 1.2 /100 | #261 | Tragic 5.6% |
| Bermudans | 1.2 /100 | #262 | Tragic 5.6% |
| Immigrants | Saudi Arabia | 1.1 /100 | #263 | Tragic 5.6% |
| Immigrants | Africa | 1.0 /100 | #264 | Tragic 5.6% |
| South Americans | 0.9 /100 | #265 | Tragic 5.6% |
| Immigrants | Nepal | 0.9 /100 | #266 | Tragic 5.6% |
| Immigrants | Ukraine | 0.9 /100 | #267 | Tragic 5.6% |
| Colombians | 0.7 /100 | #268 | Tragic 5.5% |
| Carpatho Rusyns | 0.7 /100 | #269 | Tragic 5.5% |
| Okinawans | 0.6 /100 | #270 | Tragic 5.5% |
| Immigrants | Sudan | 0.6 /100 | #271 | Tragic 5.5% |
| Immigrants | Kazakhstan | 0.6 /100 | #272 | Tragic 5.5% |
Demographics Similar to Immigrants from Chile by 4 or more Vehicles in Household
In terms of 4 or more vehicles in household, the demographic groups most similar to Immigrants from Chile are Immigrants from Nigeria (6.1%, a difference of 0.27%), Kenyan (6.1%, a difference of 0.28%), Immigrants from Honduras (6.1%, a difference of 0.30%), Immigrants from Zimbabwe (6.0%, a difference of 0.35%), and Honduran (6.1%, a difference of 0.42%).
| Demographics | Rating | Rank | 4 or more Vehicles in Household |
| Latvians | 21.7 /100 | #200 | Fair 6.1% |
| Egyptians | 21.4 /100 | #201 | Fair 6.1% |
| Immigrants | South Central Asia | 21.3 /100 | #202 | Fair 6.1% |
| Immigrants | Sierra Leone | 20.5 /100 | #203 | Fair 6.1% |
| Immigrants | Belize | 19.8 /100 | #204 | Poor 6.1% |
| Hondurans | 19.3 /100 | #205 | Poor 6.1% |
| Kenyans | 18.5 /100 | #206 | Poor 6.1% |
| Immigrants | Chile | 16.9 /100 | #207 | Poor 6.1% |
| Immigrants | Nigeria | 15.6 /100 | #208 | Poor 6.1% |
| Immigrants | Honduras | 15.4 /100 | #209 | Poor 6.1% |
| Immigrants | Zimbabwe | 15.1 /100 | #210 | Poor 6.0% |
| Panamanians | 14.8 /100 | #211 | Poor 6.0% |
| Immigrants | Egypt | 14.7 /100 | #212 | Poor 6.0% |
| Arabs | 14.4 /100 | #213 | Poor 6.0% |
| Immigrants | Austria | 14.3 /100 | #214 | Poor 6.0% |