Czech vs Bhutanese 4 or more Vehicles in Household
COMPARE
Czech
Bhutanese
4 or more Vehicles in Household
4 or more Vehicles in Household Comparison
Czechs
Bhutanese
7.4%
4 OR MORE VEHICLES IN HOUSEHOLD
99.8/ 100
METRIC RATING
79th/ 347
METRIC RANK
7.8%
4 OR MORE VEHICLES IN HOUSEHOLD
100.0/ 100
METRIC RATING
44th/ 347
METRIC RANK
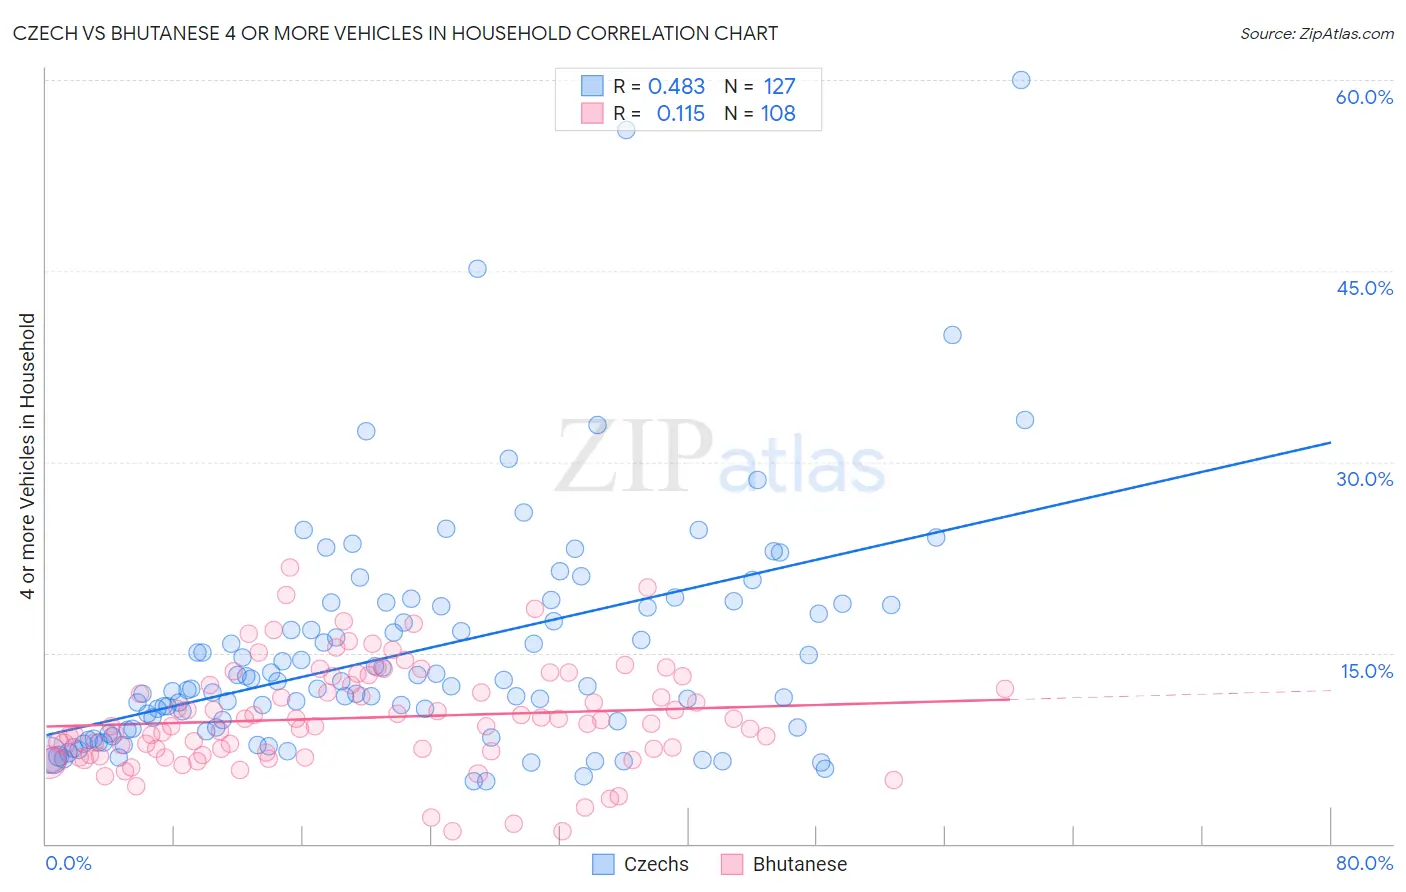
Czech vs Bhutanese 4 or more Vehicles in Household Correlation Chart
The statistical analysis conducted on geographies consisting of 482,666,265 people shows a moderate positive correlation between the proportion of Czechs and percentage of households with 4 or more vehicles available in the United States with a correlation coefficient (R) of 0.483 and weighted average of 7.4%. Similarly, the statistical analysis conducted on geographies consisting of 453,167,793 people shows a poor positive correlation between the proportion of Bhutanese and percentage of households with 4 or more vehicles available in the United States with a correlation coefficient (R) of 0.115 and weighted average of 7.8%, a difference of 6.1%.
4 or more Vehicles in Household Correlation Summary
| Measurement | Czech | Bhutanese |
| Minimum | 4.9% | 0.93% |
| Maximum | 60.0% | 21.7% |
| Range | 55.1% | 20.7% |
| Mean | 14.9% | 9.9% |
| Median | 12.3% | 9.3% |
| Interquartile 25% (IQ1) | 8.9% | 7.1% |
| Interquartile 75% (IQ3) | 18.6% | 12.8% |
| Interquartile Range (IQR) | 9.8% | 5.7% |
| Standard Deviation (Sample) | 9.1% | 4.1% |
| Standard Deviation (Population) | 9.0% | 4.1% |
Similar Demographics by 4 or more Vehicles in Household
Demographics Similar to Czechs by 4 or more Vehicles in Household
In terms of 4 or more vehicles in household, the demographic groups most similar to Czechs are Alaska Native (7.3%, a difference of 0.14%), White/Caucasian (7.4%, a difference of 0.17%), Apache (7.4%, a difference of 0.24%), Laotian (7.4%, a difference of 0.41%), and Icelander (7.4%, a difference of 0.46%).
| Demographics | Rating | Rank | 4 or more Vehicles in Household |
| Scotch-Irish | 99.9 /100 | #72 | Exceptional 7.4% |
| Portuguese | 99.9 /100 | #73 | Exceptional 7.4% |
| Icelanders | 99.9 /100 | #74 | Exceptional 7.4% |
| Immigrants | Cambodia | 99.9 /100 | #75 | Exceptional 7.4% |
| Laotians | 99.9 /100 | #76 | Exceptional 7.4% |
| Apache | 99.9 /100 | #77 | Exceptional 7.4% |
| Whites/Caucasians | 99.8 /100 | #78 | Exceptional 7.4% |
| Czechs | 99.8 /100 | #79 | Exceptional 7.4% |
| Alaska Natives | 99.8 /100 | #80 | Exceptional 7.3% |
| Finns | 99.8 /100 | #81 | Exceptional 7.3% |
| Northern Europeans | 99.8 /100 | #82 | Exceptional 7.3% |
| Potawatomi | 99.7 /100 | #83 | Exceptional 7.3% |
| Afghans | 99.7 /100 | #84 | Exceptional 7.3% |
| Cree | 99.7 /100 | #85 | Exceptional 7.2% |
| Immigrants | Indonesia | 99.6 /100 | #86 | Exceptional 7.2% |
Demographics Similar to Bhutanese by 4 or more Vehicles in Household
In terms of 4 or more vehicles in household, the demographic groups most similar to Bhutanese are Choctaw (7.8%, a difference of 0.050%), Crow (7.8%, a difference of 0.22%), Fijian (7.8%, a difference of 0.26%), Salvadoran (7.8%, a difference of 0.38%), and Osage (7.8%, a difference of 0.38%).
| Demographics | Rating | Rank | 4 or more Vehicles in Household |
| Scandinavians | 100.0 /100 | #37 | Exceptional 8.0% |
| Sioux | 100.0 /100 | #38 | Exceptional 8.0% |
| Spanish Americans | 100.0 /100 | #39 | Exceptional 8.0% |
| Spanish | 100.0 /100 | #40 | Exceptional 7.9% |
| Pima | 100.0 /100 | #41 | Exceptional 7.9% |
| Salvadorans | 100.0 /100 | #42 | Exceptional 7.8% |
| Fijians | 100.0 /100 | #43 | Exceptional 7.8% |
| Bhutanese | 100.0 /100 | #44 | Exceptional 7.8% |
| Choctaw | 100.0 /100 | #45 | Exceptional 7.8% |
| Crow | 100.0 /100 | #46 | Exceptional 7.8% |
| Osage | 100.0 /100 | #47 | Exceptional 7.8% |
| Swiss | 100.0 /100 | #48 | Exceptional 7.8% |
| Cherokee | 100.0 /100 | #49 | Exceptional 7.7% |
| Immigrants | El Salvador | 100.0 /100 | #50 | Exceptional 7.7% |
| Immigrants | Laos | 100.0 /100 | #51 | Exceptional 7.7% |