Czech vs Immigrants from Chile Disability Age Over 75
COMPARE
Czech
Immigrants from Chile
Disability Age Over 75
Disability Age Over 75 Comparison
Czechs
Immigrants from Chile
45.7%
DISABILITY AGE OVER 75
99.8/ 100
METRIC RATING
43rd/ 347
METRIC RANK
46.5%
DISABILITY AGE OVER 75
96.4/ 100
METRIC RATING
111th/ 347
METRIC RANK
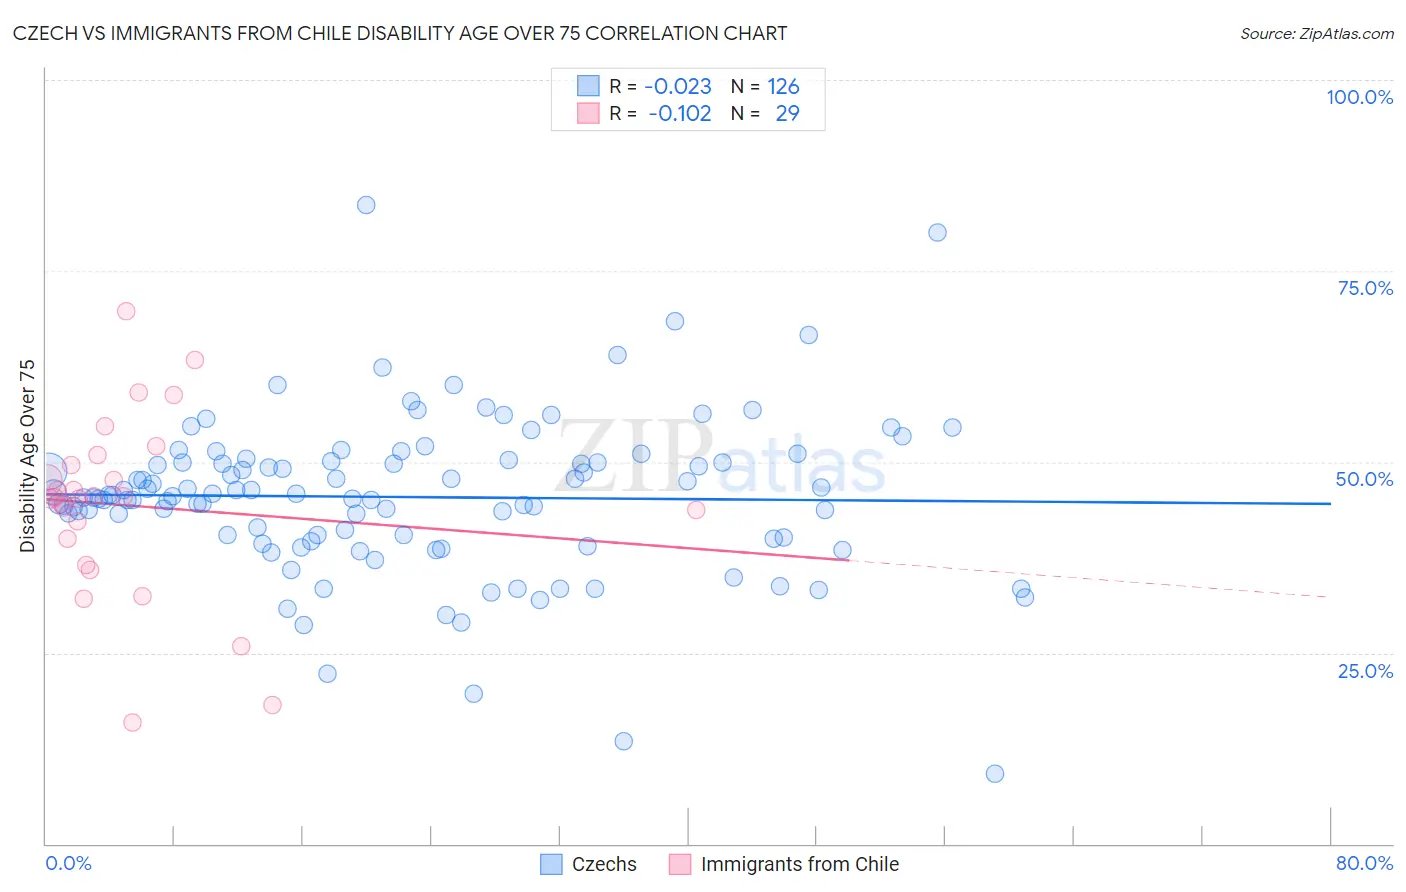
Czech vs Immigrants from Chile Disability Age Over 75 Correlation Chart
The statistical analysis conducted on geographies consisting of 483,617,393 people shows no correlation between the proportion of Czechs and percentage of population with a disability over the age of 75 in the United States with a correlation coefficient (R) of -0.023 and weighted average of 45.7%. Similarly, the statistical analysis conducted on geographies consisting of 218,556,644 people shows a poor negative correlation between the proportion of Immigrants from Chile and percentage of population with a disability over the age of 75 in the United States with a correlation coefficient (R) of -0.102 and weighted average of 46.5%, a difference of 1.8%.
Disability Age Over 75 Correlation Summary
| Measurement | Czech | Immigrants from Chile |
| Minimum | 9.1% | 15.8% |
| Maximum | 83.6% | 69.8% |
| Range | 74.6% | 54.0% |
| Mean | 45.4% | 44.3% |
| Median | 45.6% | 45.3% |
| Interquartile 25% (IQ1) | 40.1% | 38.3% |
| Interquartile 75% (IQ3) | 50.0% | 50.2% |
| Interquartile Range (IQR) | 9.9% | 12.0% |
| Standard Deviation (Sample) | 10.4% | 11.9% |
| Standard Deviation (Population) | 10.4% | 11.7% |
Similar Demographics by Disability Age Over 75
Demographics Similar to Czechs by Disability Age Over 75
In terms of disability age over 75, the demographic groups most similar to Czechs are Greek (45.6%, a difference of 0.0%), Australian (45.7%, a difference of 0.040%), Turkish (45.7%, a difference of 0.040%), Immigrants from Singapore (45.6%, a difference of 0.050%), and Swedish (45.7%, a difference of 0.070%).
| Demographics | Rating | Rank | Disability Age Over 75 |
| Immigrants | Taiwan | 99.9 /100 | #36 | Exceptional 45.5% |
| South Africans | 99.9 /100 | #37 | Exceptional 45.5% |
| Italians | 99.9 /100 | #38 | Exceptional 45.6% |
| Estonians | 99.9 /100 | #39 | Exceptional 45.6% |
| Slovenes | 99.9 /100 | #40 | Exceptional 45.6% |
| Immigrants | Singapore | 99.8 /100 | #41 | Exceptional 45.6% |
| Greeks | 99.8 /100 | #42 | Exceptional 45.6% |
| Czechs | 99.8 /100 | #43 | Exceptional 45.7% |
| Australians | 99.8 /100 | #44 | Exceptional 45.7% |
| Turks | 99.8 /100 | #45 | Exceptional 45.7% |
| Swedes | 99.8 /100 | #46 | Exceptional 45.7% |
| Immigrants | Canada | 99.8 /100 | #47 | Exceptional 45.7% |
| Croatians | 99.8 /100 | #48 | Exceptional 45.7% |
| Immigrants | North America | 99.8 /100 | #49 | Exceptional 45.7% |
| Belgians | 99.7 /100 | #50 | Exceptional 45.8% |
Demographics Similar to Immigrants from Chile by Disability Age Over 75
In terms of disability age over 75, the demographic groups most similar to Immigrants from Chile are Immigrants from Hong Kong (46.5%, a difference of 0.0%), Chilean (46.5%, a difference of 0.010%), Brazilian (46.5%, a difference of 0.040%), Immigrants from Pakistan (46.5%, a difference of 0.040%), and Immigrants from Uruguay (46.4%, a difference of 0.050%).
| Demographics | Rating | Rank | Disability Age Over 75 |
| Israelis | 97.0 /100 | #104 | Exceptional 46.4% |
| Immigrants | Cameroon | 96.9 /100 | #105 | Exceptional 46.4% |
| Immigrants | Kuwait | 96.8 /100 | #106 | Exceptional 46.4% |
| Immigrants | Uruguay | 96.7 /100 | #107 | Exceptional 46.4% |
| Brazilians | 96.6 /100 | #108 | Exceptional 46.5% |
| Chileans | 96.4 /100 | #109 | Exceptional 46.5% |
| Immigrants | Hong Kong | 96.4 /100 | #110 | Exceptional 46.5% |
| Immigrants | Chile | 96.4 /100 | #111 | Exceptional 46.5% |
| Immigrants | Pakistan | 96.1 /100 | #112 | Exceptional 46.5% |
| Irish | 96.0 /100 | #113 | Exceptional 46.5% |
| Dutch | 95.9 /100 | #114 | Exceptional 46.5% |
| British | 95.7 /100 | #115 | Exceptional 46.5% |
| Indians (Asian) | 95.7 /100 | #116 | Exceptional 46.5% |
| Hungarians | 95.3 /100 | #117 | Exceptional 46.5% |
| Czechoslovakians | 94.7 /100 | #118 | Exceptional 46.6% |