Czech vs Pennsylvania German 4 or more Vehicles in Household
COMPARE
Czech
Pennsylvania German
4 or more Vehicles in Household
4 or more Vehicles in Household Comparison
Czechs
Pennsylvania Germans
7.4%
4 OR MORE VEHICLES IN HOUSEHOLD
99.8/ 100
METRIC RATING
79th/ 347
METRIC RANK
7.6%
4 OR MORE VEHICLES IN HOUSEHOLD
100.0/ 100
METRIC RATING
57th/ 347
METRIC RANK
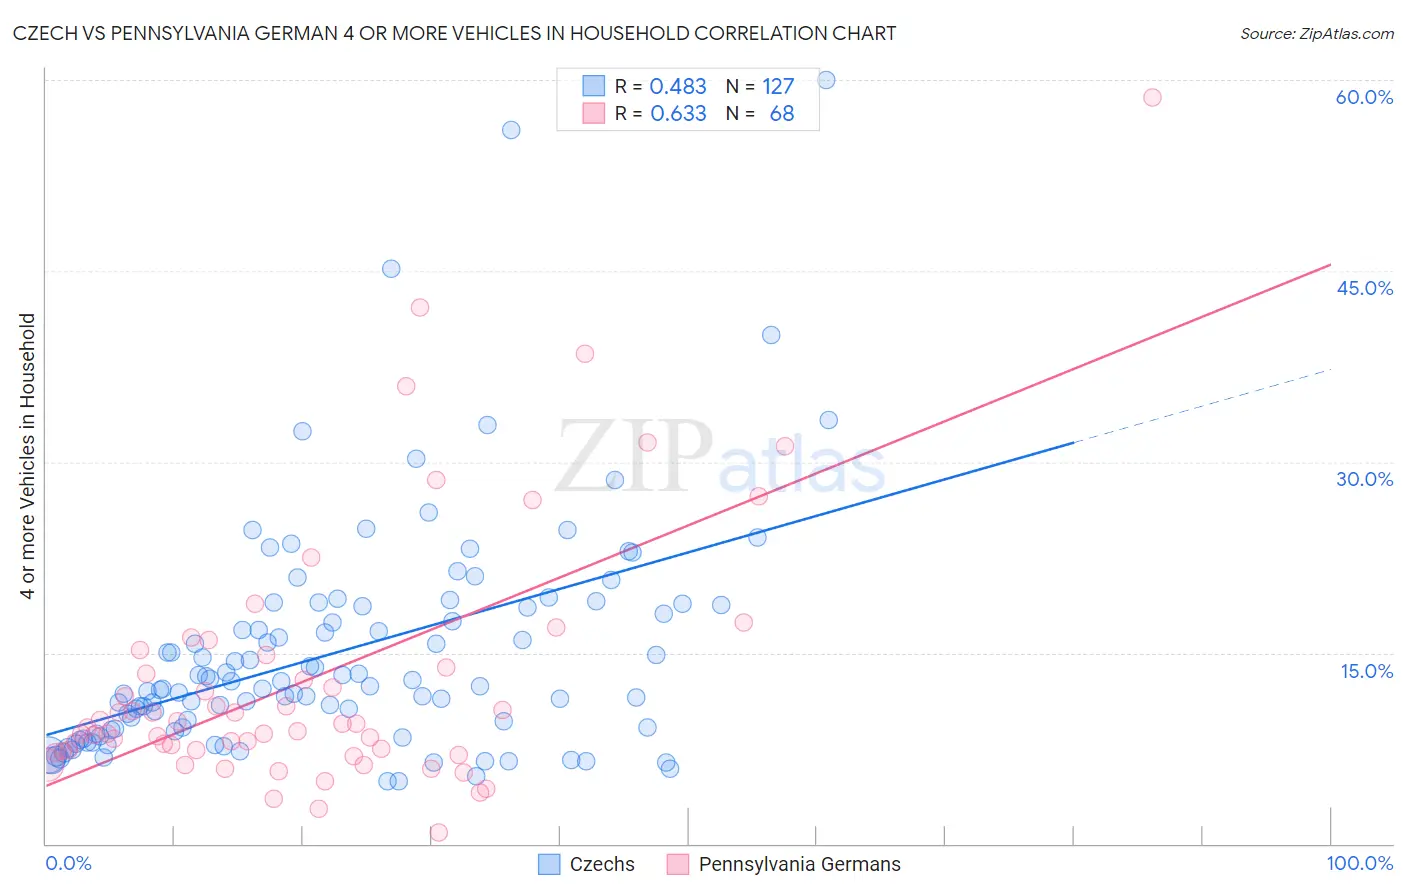
Czech vs Pennsylvania German 4 or more Vehicles in Household Correlation Chart
The statistical analysis conducted on geographies consisting of 482,666,265 people shows a moderate positive correlation between the proportion of Czechs and percentage of households with 4 or more vehicles available in the United States with a correlation coefficient (R) of 0.483 and weighted average of 7.4%. Similarly, the statistical analysis conducted on geographies consisting of 233,625,360 people shows a significant positive correlation between the proportion of Pennsylvania Germans and percentage of households with 4 or more vehicles available in the United States with a correlation coefficient (R) of 0.633 and weighted average of 7.6%, a difference of 3.6%.
4 or more Vehicles in Household Correlation Summary
| Measurement | Czech | Pennsylvania German |
| Minimum | 4.9% | 0.85% |
| Maximum | 60.0% | 58.6% |
| Range | 55.1% | 57.8% |
| Mean | 14.9% | 12.9% |
| Median | 12.3% | 9.3% |
| Interquartile 25% (IQ1) | 8.9% | 7.3% |
| Interquartile 75% (IQ3) | 18.6% | 14.4% |
| Interquartile Range (IQR) | 9.8% | 7.1% |
| Standard Deviation (Sample) | 9.1% | 10.3% |
| Standard Deviation (Population) | 9.0% | 10.3% |
Similar Demographics by 4 or more Vehicles in Household
Demographics Similar to Czechs by 4 or more Vehicles in Household
In terms of 4 or more vehicles in household, the demographic groups most similar to Czechs are Alaska Native (7.3%, a difference of 0.14%), White/Caucasian (7.4%, a difference of 0.17%), Apache (7.4%, a difference of 0.24%), Laotian (7.4%, a difference of 0.41%), and Icelander (7.4%, a difference of 0.46%).
| Demographics | Rating | Rank | 4 or more Vehicles in Household |
| Scotch-Irish | 99.9 /100 | #72 | Exceptional 7.4% |
| Portuguese | 99.9 /100 | #73 | Exceptional 7.4% |
| Icelanders | 99.9 /100 | #74 | Exceptional 7.4% |
| Immigrants | Cambodia | 99.9 /100 | #75 | Exceptional 7.4% |
| Laotians | 99.9 /100 | #76 | Exceptional 7.4% |
| Apache | 99.9 /100 | #77 | Exceptional 7.4% |
| Whites/Caucasians | 99.8 /100 | #78 | Exceptional 7.4% |
| Czechs | 99.8 /100 | #79 | Exceptional 7.4% |
| Alaska Natives | 99.8 /100 | #80 | Exceptional 7.3% |
| Finns | 99.8 /100 | #81 | Exceptional 7.3% |
| Northern Europeans | 99.8 /100 | #82 | Exceptional 7.3% |
| Potawatomi | 99.7 /100 | #83 | Exceptional 7.3% |
| Afghans | 99.7 /100 | #84 | Exceptional 7.3% |
| Cree | 99.7 /100 | #85 | Exceptional 7.2% |
| Immigrants | Indonesia | 99.6 /100 | #86 | Exceptional 7.2% |
Demographics Similar to Pennsylvania Germans by 4 or more Vehicles in Household
In terms of 4 or more vehicles in household, the demographic groups most similar to Pennsylvania Germans are Swedish (7.6%, a difference of 0.0%), Hispanic or Latino (7.6%, a difference of 0.040%), Spaniard (7.6%, a difference of 0.10%), English (7.6%, a difference of 0.12%), and Immigrants from Oceania (7.6%, a difference of 0.14%).
| Demographics | Rating | Rank | 4 or more Vehicles in Household |
| Immigrants | El Salvador | 100.0 /100 | #50 | Exceptional 7.7% |
| Immigrants | Laos | 100.0 /100 | #51 | Exceptional 7.7% |
| Japanese | 100.0 /100 | #52 | Exceptional 7.7% |
| Malaysians | 100.0 /100 | #53 | Exceptional 7.7% |
| Dutch | 100.0 /100 | #54 | Exceptional 7.7% |
| Immigrants | Oceania | 100.0 /100 | #55 | Exceptional 7.6% |
| English | 100.0 /100 | #56 | Exceptional 7.6% |
| Pennsylvania Germans | 100.0 /100 | #57 | Exceptional 7.6% |
| Swedes | 100.0 /100 | #58 | Exceptional 7.6% |
| Hispanics or Latinos | 100.0 /100 | #59 | Exceptional 7.6% |
| Spaniards | 100.0 /100 | #60 | Exceptional 7.6% |
| Europeans | 100.0 /100 | #61 | Exceptional 7.6% |
| Chippewa | 100.0 /100 | #62 | Exceptional 7.6% |
| Immigrants | Micronesia | 100.0 /100 | #63 | Exceptional 7.6% |
| Bangladeshis | 100.0 /100 | #64 | Exceptional 7.6% |