Czech vs Asian 4 or more Vehicles in Household
COMPARE
Czech
Asian
4 or more Vehicles in Household
4 or more Vehicles in Household Comparison
Czechs
Asians
7.4%
4 OR MORE VEHICLES IN HOUSEHOLD
99.8/ 100
METRIC RATING
79th/ 347
METRIC RANK
7.0%
4 OR MORE VEHICLES IN HOUSEHOLD
98.6/ 100
METRIC RATING
102nd/ 347
METRIC RANK
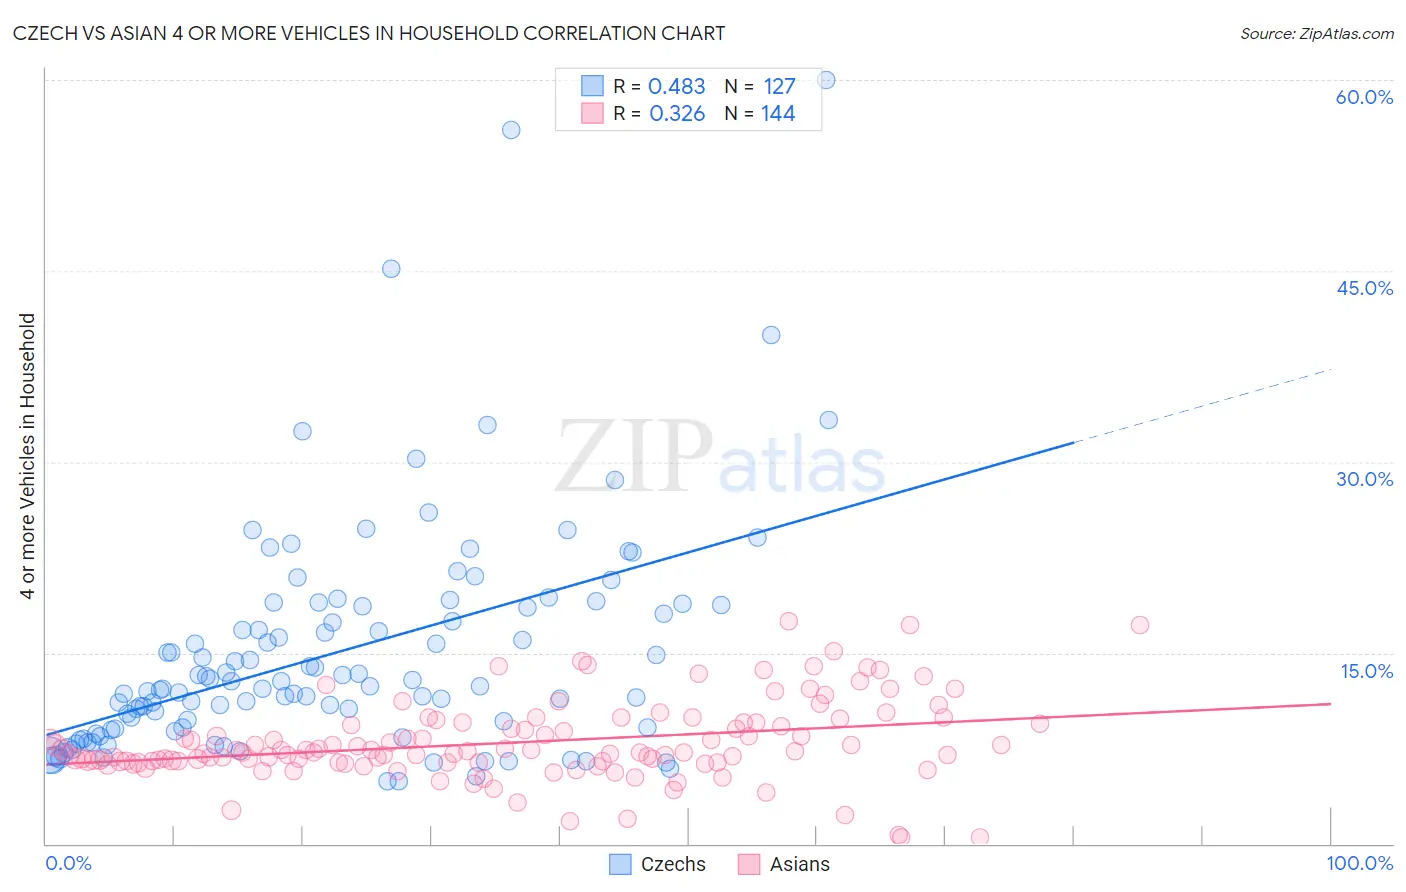
Czech vs Asian 4 or more Vehicles in Household Correlation Chart
The statistical analysis conducted on geographies consisting of 482,666,265 people shows a moderate positive correlation between the proportion of Czechs and percentage of households with 4 or more vehicles available in the United States with a correlation coefficient (R) of 0.483 and weighted average of 7.4%. Similarly, the statistical analysis conducted on geographies consisting of 547,642,894 people shows a mild positive correlation between the proportion of Asians and percentage of households with 4 or more vehicles available in the United States with a correlation coefficient (R) of 0.326 and weighted average of 7.0%, a difference of 4.9%.
4 or more Vehicles in Household Correlation Summary
| Measurement | Czech | Asian |
| Minimum | 4.9% | 0.45% |
| Maximum | 60.0% | 17.5% |
| Range | 55.1% | 17.0% |
| Mean | 14.9% | 7.9% |
| Median | 12.3% | 7.2% |
| Interquartile 25% (IQ1) | 8.9% | 6.4% |
| Interquartile 75% (IQ3) | 18.6% | 9.5% |
| Interquartile Range (IQR) | 9.8% | 3.0% |
| Standard Deviation (Sample) | 9.1% | 3.1% |
| Standard Deviation (Population) | 9.0% | 3.1% |
Similar Demographics by 4 or more Vehicles in Household
Demographics Similar to Czechs by 4 or more Vehicles in Household
In terms of 4 or more vehicles in household, the demographic groups most similar to Czechs are Alaska Native (7.3%, a difference of 0.14%), White/Caucasian (7.4%, a difference of 0.17%), Apache (7.4%, a difference of 0.24%), Laotian (7.4%, a difference of 0.41%), and Icelander (7.4%, a difference of 0.46%).
| Demographics | Rating | Rank | 4 or more Vehicles in Household |
| Scotch-Irish | 99.9 /100 | #72 | Exceptional 7.4% |
| Portuguese | 99.9 /100 | #73 | Exceptional 7.4% |
| Icelanders | 99.9 /100 | #74 | Exceptional 7.4% |
| Immigrants | Cambodia | 99.9 /100 | #75 | Exceptional 7.4% |
| Laotians | 99.9 /100 | #76 | Exceptional 7.4% |
| Apache | 99.9 /100 | #77 | Exceptional 7.4% |
| Whites/Caucasians | 99.8 /100 | #78 | Exceptional 7.4% |
| Czechs | 99.8 /100 | #79 | Exceptional 7.4% |
| Alaska Natives | 99.8 /100 | #80 | Exceptional 7.3% |
| Finns | 99.8 /100 | #81 | Exceptional 7.3% |
| Northern Europeans | 99.8 /100 | #82 | Exceptional 7.3% |
| Potawatomi | 99.7 /100 | #83 | Exceptional 7.3% |
| Afghans | 99.7 /100 | #84 | Exceptional 7.3% |
| Cree | 99.7 /100 | #85 | Exceptional 7.2% |
| Immigrants | Indonesia | 99.6 /100 | #86 | Exceptional 7.2% |
Demographics Similar to Asians by 4 or more Vehicles in Household
In terms of 4 or more vehicles in household, the demographic groups most similar to Asians are Blackfeet (7.0%, a difference of 0.010%), Pakistani (7.0%, a difference of 0.070%), Taiwanese (7.0%, a difference of 0.14%), Seminole (7.0%, a difference of 0.21%), and Hmong (7.0%, a difference of 0.49%).
| Demographics | Rating | Rank | 4 or more Vehicles in Household |
| Czechoslovakians | 99.3 /100 | #95 | Exceptional 7.1% |
| Central Americans | 99.3 /100 | #96 | Exceptional 7.1% |
| Celtics | 99.1 /100 | #97 | Exceptional 7.1% |
| Irish | 99.0 /100 | #98 | Exceptional 7.1% |
| Seminole | 98.8 /100 | #99 | Exceptional 7.0% |
| Taiwanese | 98.7 /100 | #100 | Exceptional 7.0% |
| Pakistanis | 98.7 /100 | #101 | Exceptional 7.0% |
| Asians | 98.6 /100 | #102 | Exceptional 7.0% |
| Blackfeet | 98.6 /100 | #103 | Exceptional 7.0% |
| Hmong | 98.3 /100 | #104 | Exceptional 7.0% |
| German Russians | 98.3 /100 | #105 | Exceptional 7.0% |
| Guatemalans | 98.1 /100 | #106 | Exceptional 7.0% |
| Nicaraguans | 98.0 /100 | #107 | Exceptional 7.0% |
| French | 97.7 /100 | #108 | Exceptional 6.9% |
| Filipinos | 97.6 /100 | #109 | Exceptional 6.9% |