Immigrants from Hong Kong vs Immigrants from Chile 4 or more Vehicles in Household
COMPARE
Immigrants from Hong Kong
Immigrants from Chile
4 or more Vehicles in Household
4 or more Vehicles in Household Comparison
Immigrants from Hong Kong
Immigrants from Chile
6.5%
4 OR MORE VEHICLES IN HOUSEHOLD
72.2/ 100
METRIC RATING
151st/ 347
METRIC RANK
6.1%
4 OR MORE VEHICLES IN HOUSEHOLD
16.9/ 100
METRIC RATING
207th/ 347
METRIC RANK
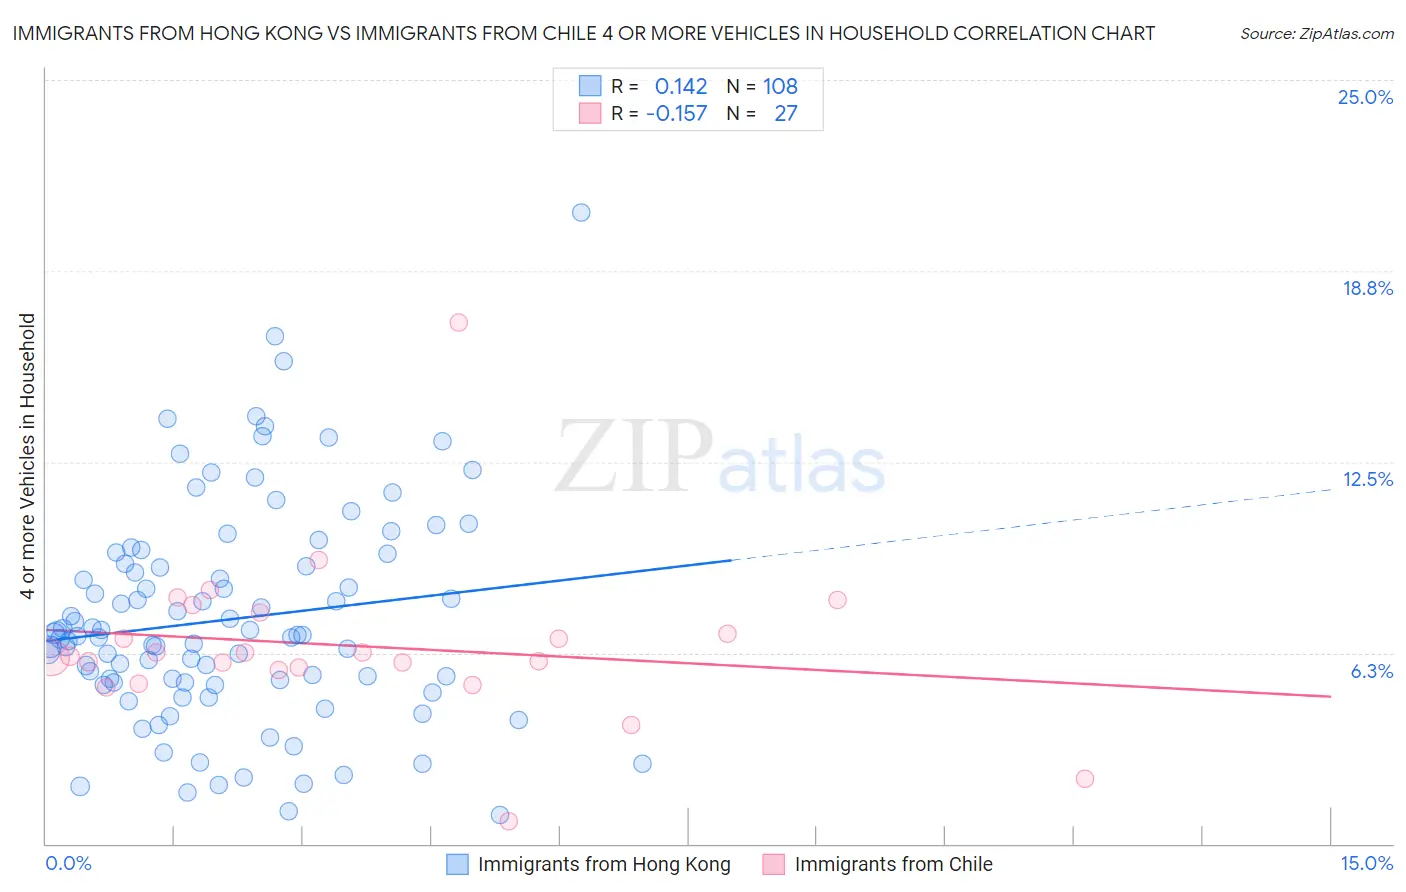
Immigrants from Hong Kong vs Immigrants from Chile 4 or more Vehicles in Household Correlation Chart
The statistical analysis conducted on geographies consisting of 252,698,345 people shows a poor positive correlation between the proportion of Immigrants from Hong Kong and percentage of households with 4 or more vehicles available in the United States with a correlation coefficient (R) of 0.142 and weighted average of 6.5%. Similarly, the statistical analysis conducted on geographies consisting of 217,712,613 people shows a poor negative correlation between the proportion of Immigrants from Chile and percentage of households with 4 or more vehicles available in the United States with a correlation coefficient (R) of -0.157 and weighted average of 6.1%, a difference of 6.7%.
4 or more Vehicles in Household Correlation Summary
| Measurement | Immigrants from Hong Kong | Immigrants from Chile |
| Minimum | 0.93% | 0.72% |
| Maximum | 20.7% | 17.1% |
| Range | 19.7% | 16.4% |
| Mean | 7.3% | 6.5% |
| Median | 6.8% | 6.1% |
| Interquartile 25% (IQ1) | 5.3% | 5.7% |
| Interquartile 75% (IQ3) | 9.1% | 7.6% |
| Interquartile Range (IQR) | 3.9% | 1.9% |
| Standard Deviation (Sample) | 3.5% | 2.8% |
| Standard Deviation (Population) | 3.5% | 2.7% |
Similar Demographics by 4 or more Vehicles in Household
Demographics Similar to Immigrants from Hong Kong by 4 or more Vehicles in Household
In terms of 4 or more vehicles in household, the demographic groups most similar to Immigrants from Hong Kong are Yuman (6.5%, a difference of 0.010%), Immigrants from Armenia (6.5%, a difference of 0.13%), New Zealander (6.5%, a difference of 0.14%), Central American Indian (6.5%, a difference of 0.14%), and Immigrants from Jordan (6.5%, a difference of 0.18%).
| Demographics | Rating | Rank | 4 or more Vehicles in Household |
| Immigrants | North America | 78.5 /100 | #144 | Good 6.5% |
| Croatians | 77.8 /100 | #145 | Good 6.5% |
| Immigrants | Costa Rica | 74.4 /100 | #146 | Good 6.5% |
| Immigrants | Iran | 73.9 /100 | #147 | Good 6.5% |
| Immigrants | Jordan | 73.7 /100 | #148 | Good 6.5% |
| Greeks | 73.6 /100 | #149 | Good 6.5% |
| New Zealanders | 73.3 /100 | #150 | Good 6.5% |
| Immigrants | Hong Kong | 72.2 /100 | #151 | Good 6.5% |
| Yuman | 72.1 /100 | #152 | Good 6.5% |
| Immigrants | Armenia | 71.2 /100 | #153 | Good 6.5% |
| Central American Indians | 71.1 /100 | #154 | Good 6.5% |
| Iroquois | 70.4 /100 | #155 | Good 6.5% |
| Iranians | 69.9 /100 | #156 | Good 6.5% |
| Peruvians | 69.4 /100 | #157 | Good 6.5% |
| Zimbabweans | 67.1 /100 | #158 | Good 6.4% |
Demographics Similar to Immigrants from Chile by 4 or more Vehicles in Household
In terms of 4 or more vehicles in household, the demographic groups most similar to Immigrants from Chile are Immigrants from Nigeria (6.1%, a difference of 0.27%), Kenyan (6.1%, a difference of 0.28%), Immigrants from Honduras (6.1%, a difference of 0.30%), Immigrants from Zimbabwe (6.0%, a difference of 0.35%), and Honduran (6.1%, a difference of 0.42%).
| Demographics | Rating | Rank | 4 or more Vehicles in Household |
| Latvians | 21.7 /100 | #200 | Fair 6.1% |
| Egyptians | 21.4 /100 | #201 | Fair 6.1% |
| Immigrants | South Central Asia | 21.3 /100 | #202 | Fair 6.1% |
| Immigrants | Sierra Leone | 20.5 /100 | #203 | Fair 6.1% |
| Immigrants | Belize | 19.8 /100 | #204 | Poor 6.1% |
| Hondurans | 19.3 /100 | #205 | Poor 6.1% |
| Kenyans | 18.5 /100 | #206 | Poor 6.1% |
| Immigrants | Chile | 16.9 /100 | #207 | Poor 6.1% |
| Immigrants | Nigeria | 15.6 /100 | #208 | Poor 6.1% |
| Immigrants | Honduras | 15.4 /100 | #209 | Poor 6.1% |
| Immigrants | Zimbabwe | 15.1 /100 | #210 | Poor 6.0% |
| Panamanians | 14.8 /100 | #211 | Poor 6.0% |
| Immigrants | Egypt | 14.7 /100 | #212 | Poor 6.0% |
| Arabs | 14.4 /100 | #213 | Poor 6.0% |
| Immigrants | Austria | 14.3 /100 | #214 | Poor 6.0% |