Australian vs Asian 4 or more Vehicles in Household
COMPARE
Australian
Asian
4 or more Vehicles in Household
4 or more Vehicles in Household Comparison
Australians
Asians
6.6%
4 OR MORE VEHICLES IN HOUSEHOLD
80.8/ 100
METRIC RATING
141st/ 347
METRIC RANK
7.0%
4 OR MORE VEHICLES IN HOUSEHOLD
98.6/ 100
METRIC RATING
102nd/ 347
METRIC RANK
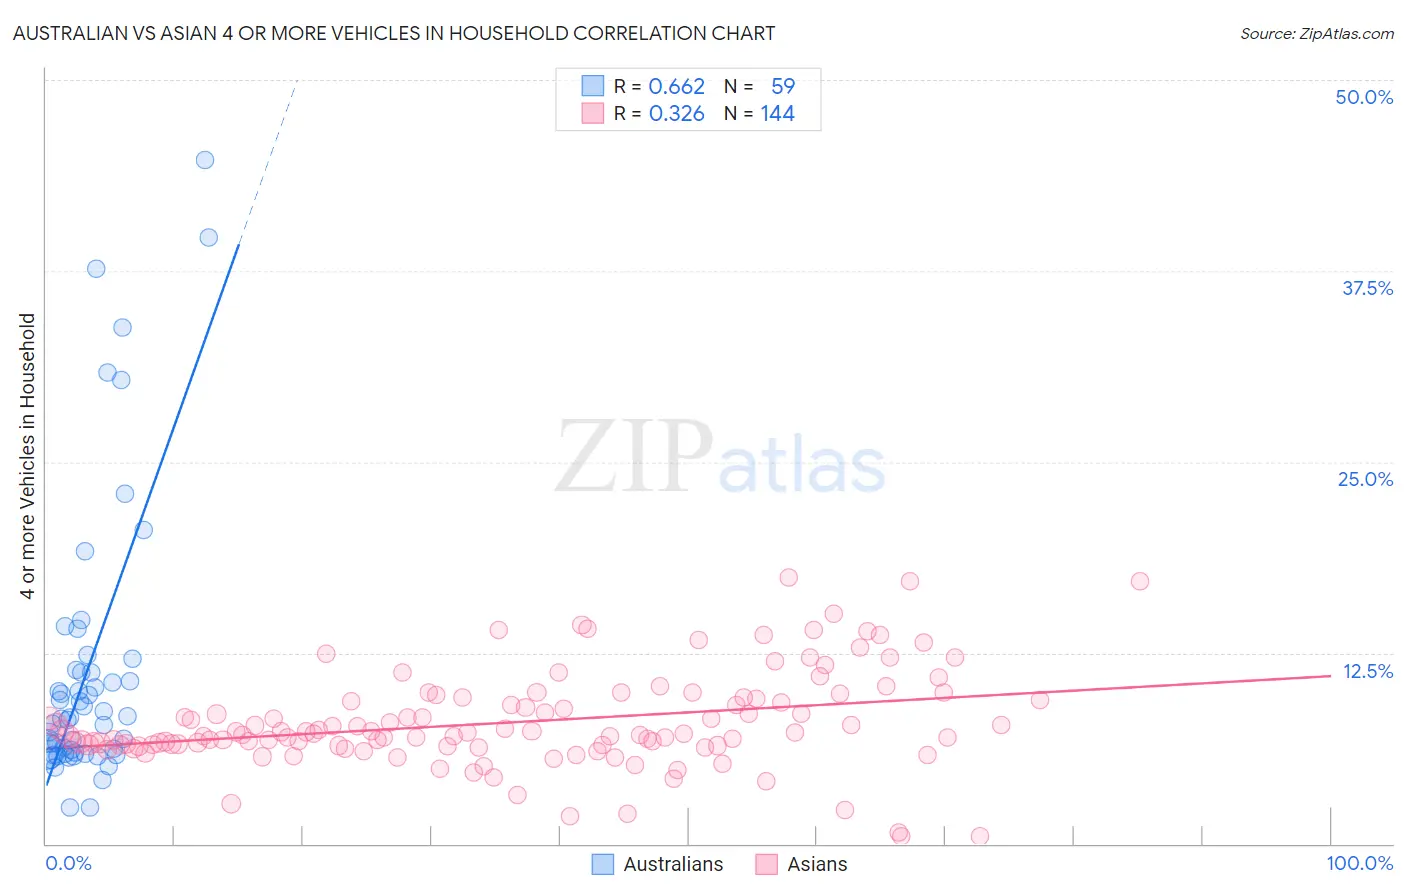
Australian vs Asian 4 or more Vehicles in Household Correlation Chart
The statistical analysis conducted on geographies consisting of 223,029,698 people shows a significant positive correlation between the proportion of Australians and percentage of households with 4 or more vehicles available in the United States with a correlation coefficient (R) of 0.662 and weighted average of 6.6%. Similarly, the statistical analysis conducted on geographies consisting of 547,642,894 people shows a mild positive correlation between the proportion of Asians and percentage of households with 4 or more vehicles available in the United States with a correlation coefficient (R) of 0.326 and weighted average of 7.0%, a difference of 7.0%.
4 or more Vehicles in Household Correlation Summary
| Measurement | Australian | Asian |
| Minimum | 2.4% | 0.45% |
| Maximum | 44.7% | 17.5% |
| Range | 42.4% | 17.0% |
| Mean | 11.5% | 7.9% |
| Median | 8.3% | 7.2% |
| Interquartile 25% (IQ1) | 6.0% | 6.4% |
| Interquartile 75% (IQ3) | 11.4% | 9.5% |
| Interquartile Range (IQR) | 5.4% | 3.0% |
| Standard Deviation (Sample) | 9.4% | 3.1% |
| Standard Deviation (Population) | 9.3% | 3.1% |
Similar Demographics by 4 or more Vehicles in Household
Demographics Similar to Australians by 4 or more Vehicles in Household
In terms of 4 or more vehicles in household, the demographic groups most similar to Australians are Slavic (6.6%, a difference of 0.13%), Immigrants from Iraq (6.5%, a difference of 0.20%), Jordanian (6.6%, a difference of 0.21%), Immigrants from Canada (6.5%, a difference of 0.33%), and Immigrants from North America (6.5%, a difference of 0.35%).
| Demographics | Rating | Rank | 4 or more Vehicles in Household |
| Ottawa | 86.9 /100 | #134 | Excellent 6.6% |
| Tohono O'odham | 86.7 /100 | #135 | Excellent 6.6% |
| Luxembourgers | 86.4 /100 | #136 | Excellent 6.6% |
| French Canadians | 85.4 /100 | #137 | Excellent 6.6% |
| Italians | 84.5 /100 | #138 | Excellent 6.6% |
| Jordanians | 82.1 /100 | #139 | Excellent 6.6% |
| Slavs | 81.6 /100 | #140 | Excellent 6.6% |
| Australians | 80.8 /100 | #141 | Excellent 6.6% |
| Immigrants | Iraq | 79.4 /100 | #142 | Good 6.5% |
| Immigrants | Canada | 78.6 /100 | #143 | Good 6.5% |
| Immigrants | North America | 78.5 /100 | #144 | Good 6.5% |
| Croatians | 77.8 /100 | #145 | Good 6.5% |
| Immigrants | Costa Rica | 74.4 /100 | #146 | Good 6.5% |
| Immigrants | Iran | 73.9 /100 | #147 | Good 6.5% |
| Immigrants | Jordan | 73.7 /100 | #148 | Good 6.5% |
Demographics Similar to Asians by 4 or more Vehicles in Household
In terms of 4 or more vehicles in household, the demographic groups most similar to Asians are Blackfeet (7.0%, a difference of 0.010%), Pakistani (7.0%, a difference of 0.070%), Taiwanese (7.0%, a difference of 0.14%), Seminole (7.0%, a difference of 0.21%), and Hmong (7.0%, a difference of 0.49%).
| Demographics | Rating | Rank | 4 or more Vehicles in Household |
| Czechoslovakians | 99.3 /100 | #95 | Exceptional 7.1% |
| Central Americans | 99.3 /100 | #96 | Exceptional 7.1% |
| Celtics | 99.1 /100 | #97 | Exceptional 7.1% |
| Irish | 99.0 /100 | #98 | Exceptional 7.1% |
| Seminole | 98.8 /100 | #99 | Exceptional 7.0% |
| Taiwanese | 98.7 /100 | #100 | Exceptional 7.0% |
| Pakistanis | 98.7 /100 | #101 | Exceptional 7.0% |
| Asians | 98.6 /100 | #102 | Exceptional 7.0% |
| Blackfeet | 98.6 /100 | #103 | Exceptional 7.0% |
| Hmong | 98.3 /100 | #104 | Exceptional 7.0% |
| German Russians | 98.3 /100 | #105 | Exceptional 7.0% |
| Guatemalans | 98.1 /100 | #106 | Exceptional 7.0% |
| Nicaraguans | 98.0 /100 | #107 | Exceptional 7.0% |
| French | 97.7 /100 | #108 | Exceptional 6.9% |
| Filipinos | 97.6 /100 | #109 | Exceptional 6.9% |