Czech vs Asian Associate's Degree
COMPARE
Czech
Asian
Associate's Degree
Associate's Degree Comparison
Czechs
Asians
47.2%
ASSOCIATE'S DEGREE
72.2/ 100
METRIC RATING
153rd/ 347
METRIC RANK
52.1%
ASSOCIATE'S DEGREE
99.9/ 100
METRIC RATING
50th/ 347
METRIC RANK
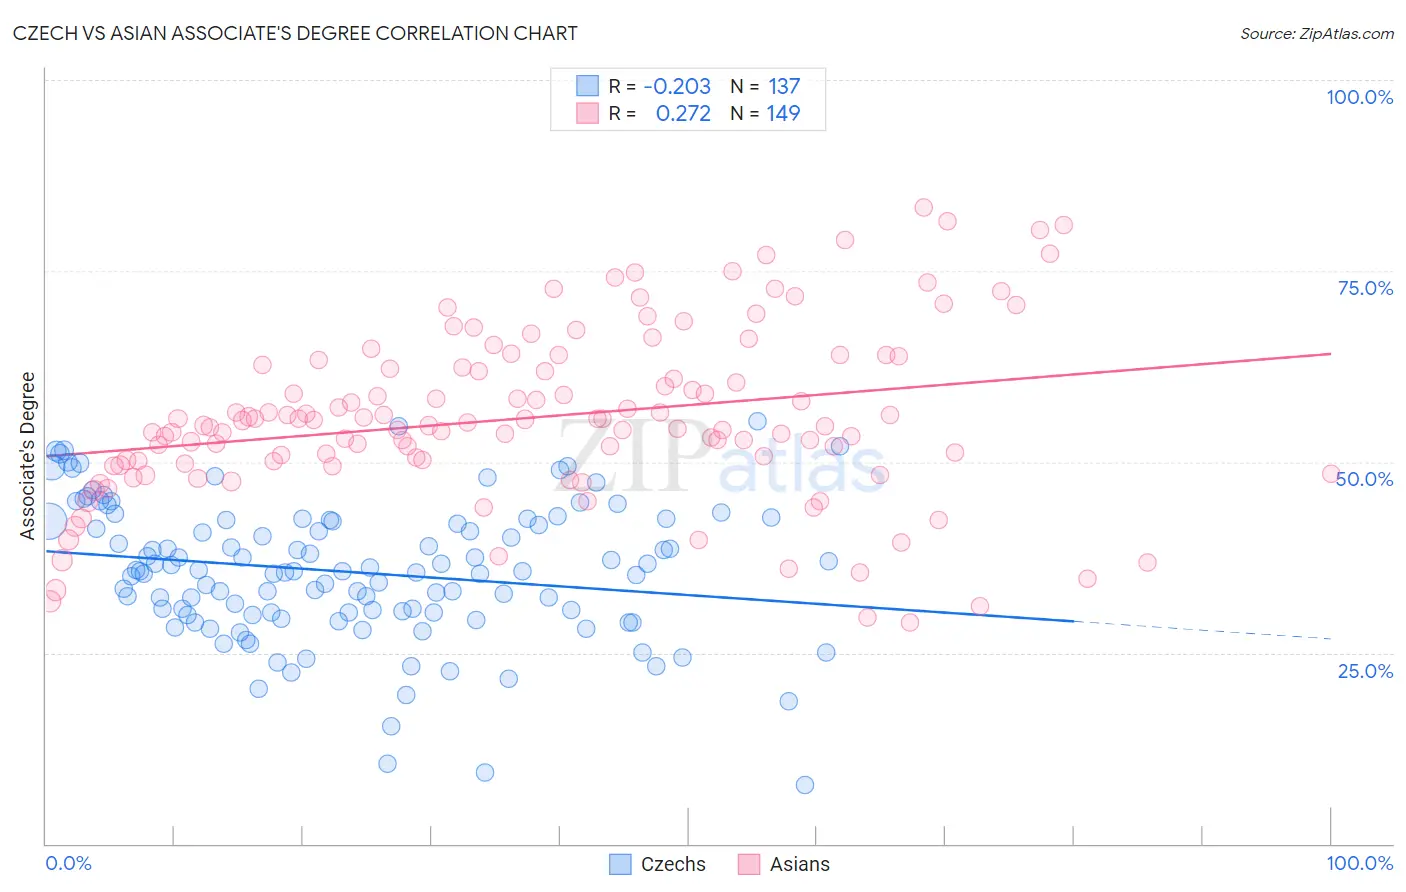
Czech vs Asian Associate's Degree Correlation Chart
The statistical analysis conducted on geographies consisting of 484,784,602 people shows a weak negative correlation between the proportion of Czechs and percentage of population with at least associate's degree education in the United States with a correlation coefficient (R) of -0.203 and weighted average of 47.2%. Similarly, the statistical analysis conducted on geographies consisting of 550,834,644 people shows a weak positive correlation between the proportion of Asians and percentage of population with at least associate's degree education in the United States with a correlation coefficient (R) of 0.272 and weighted average of 52.1%, a difference of 10.5%.
Associate's Degree Correlation Summary
| Measurement | Czech | Asian |
| Minimum | 7.7% | 29.0% |
| Maximum | 55.4% | 83.3% |
| Range | 47.7% | 54.3% |
| Mean | 35.6% | 55.8% |
| Median | 35.7% | 54.8% |
| Interquartile 25% (IQ1) | 30.1% | 49.9% |
| Interquartile 75% (IQ3) | 42.3% | 62.5% |
| Interquartile Range (IQR) | 12.2% | 12.6% |
| Standard Deviation (Sample) | 9.1% | 11.1% |
| Standard Deviation (Population) | 9.0% | 11.1% |
Similar Demographics by Associate's Degree
Demographics Similar to Czechs by Associate's Degree
In terms of associate's degree, the demographic groups most similar to Czechs are Immigrants from Kenya (47.2%, a difference of 0.010%), Kenyan (47.1%, a difference of 0.14%), South American (47.1%, a difference of 0.16%), Sudanese (47.1%, a difference of 0.18%), and Immigrants from Afghanistan (47.3%, a difference of 0.19%).
| Demographics | Rating | Rank | Associate's Degree |
| Immigrants | Sudan | 77.9 /100 | #146 | Good 47.4% |
| Danes | 77.3 /100 | #147 | Good 47.4% |
| South American Indians | 76.7 /100 | #148 | Good 47.4% |
| Immigrants | Armenia | 76.6 /100 | #149 | Good 47.4% |
| Iraqis | 76.2 /100 | #150 | Good 47.4% |
| Immigrants | North Macedonia | 76.0 /100 | #151 | Good 47.4% |
| Immigrants | Afghanistan | 74.3 /100 | #152 | Good 47.3% |
| Czechs | 72.2 /100 | #153 | Good 47.2% |
| Immigrants | Kenya | 72.1 /100 | #154 | Good 47.2% |
| Kenyans | 70.6 /100 | #155 | Good 47.1% |
| South Americans | 70.5 /100 | #156 | Good 47.1% |
| Sudanese | 70.3 /100 | #157 | Good 47.1% |
| Immigrants | Germany | 69.7 /100 | #158 | Good 47.1% |
| Immigrants | Poland | 69.2 /100 | #159 | Good 47.1% |
| Scottish | 65.4 /100 | #160 | Good 46.9% |
Demographics Similar to Asians by Associate's Degree
In terms of associate's degree, the demographic groups most similar to Asians are Immigrants from Austria (52.1%, a difference of 0.010%), Immigrants from Greece (52.1%, a difference of 0.080%), Immigrants from Norway (52.2%, a difference of 0.21%), Bolivian (52.0%, a difference of 0.29%), and Immigrants from Asia (52.0%, a difference of 0.31%).
| Demographics | Rating | Rank | Associate's Degree |
| Immigrants | South Africa | 99.9 /100 | #43 | Exceptional 52.5% |
| Estonians | 99.9 /100 | #44 | Exceptional 52.5% |
| Immigrants | Lithuania | 99.9 /100 | #45 | Exceptional 52.4% |
| Immigrants | Bulgaria | 99.9 /100 | #46 | Exceptional 52.4% |
| Immigrants | Kuwait | 99.9 /100 | #47 | Exceptional 52.4% |
| Immigrants | Norway | 99.9 /100 | #48 | Exceptional 52.2% |
| Immigrants | Austria | 99.9 /100 | #49 | Exceptional 52.1% |
| Asians | 99.9 /100 | #50 | Exceptional 52.1% |
| Immigrants | Greece | 99.9 /100 | #51 | Exceptional 52.1% |
| Bolivians | 99.8 /100 | #52 | Exceptional 52.0% |
| Immigrants | Asia | 99.8 /100 | #53 | Exceptional 52.0% |
| Immigrants | Spain | 99.8 /100 | #54 | Exceptional 51.9% |
| Australians | 99.8 /100 | #55 | Exceptional 51.9% |
| Immigrants | Czechoslovakia | 99.8 /100 | #56 | Exceptional 51.9% |
| Paraguayans | 99.8 /100 | #57 | Exceptional 51.8% |