Canadian vs Asian 4 or more Vehicles in Household
COMPARE
Canadian
Asian
4 or more Vehicles in Household
4 or more Vehicles in Household Comparison
Canadians
Asians
6.9%
4 OR MORE VEHICLES IN HOUSEHOLD
96.4/ 100
METRIC RATING
113th/ 347
METRIC RANK
7.0%
4 OR MORE VEHICLES IN HOUSEHOLD
98.6/ 100
METRIC RATING
102nd/ 347
METRIC RANK
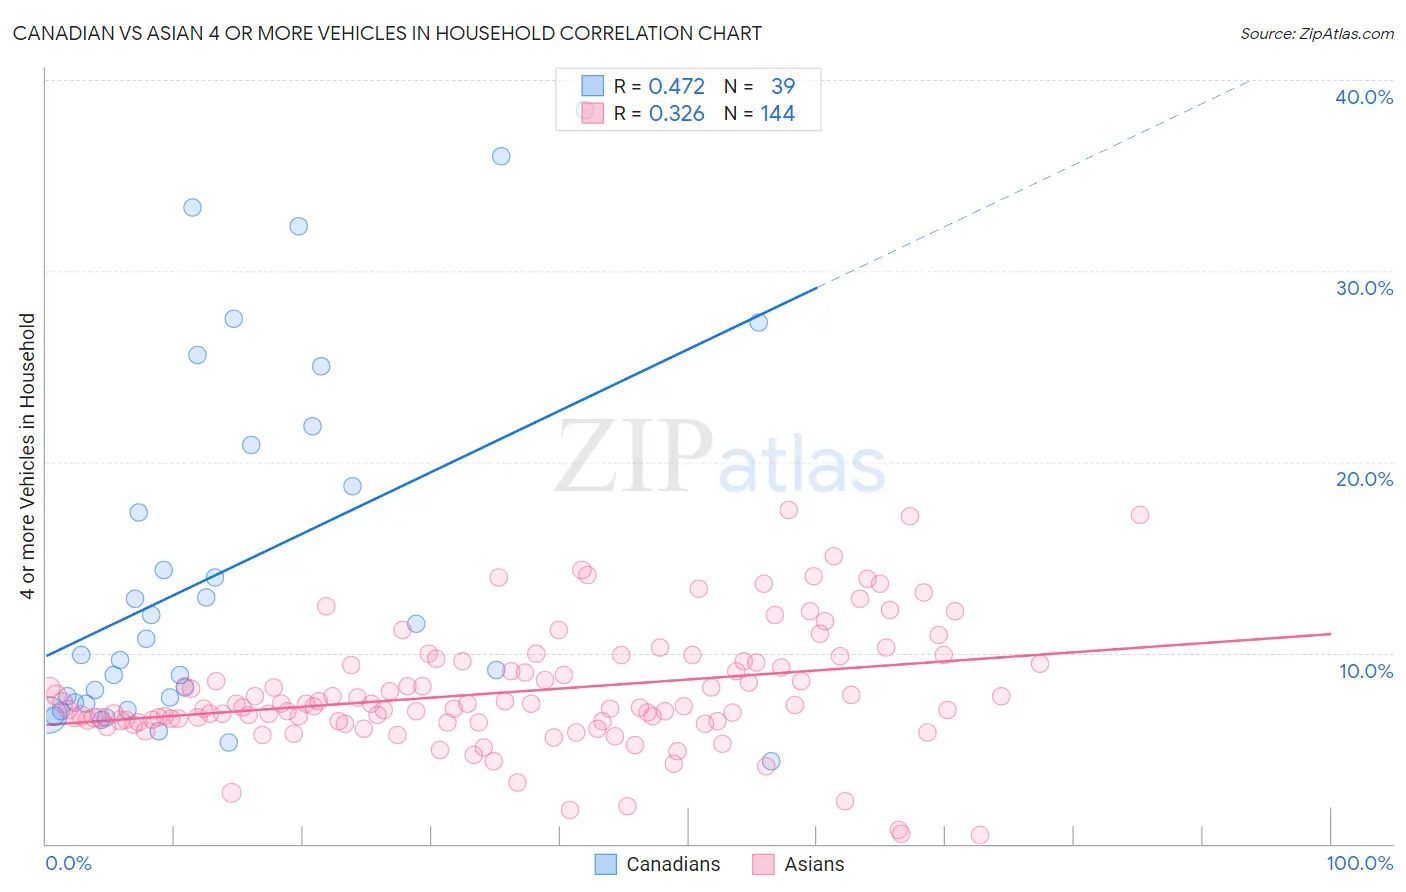
Canadian vs Asian 4 or more Vehicles in Household Correlation Chart
The statistical analysis conducted on geographies consisting of 435,609,846 people shows a moderate positive correlation between the proportion of Canadians and percentage of households with 4 or more vehicles available in the United States with a correlation coefficient (R) of 0.472 and weighted average of 6.9%. Similarly, the statistical analysis conducted on geographies consisting of 547,642,894 people shows a mild positive correlation between the proportion of Asians and percentage of households with 4 or more vehicles available in the United States with a correlation coefficient (R) of 0.326 and weighted average of 7.0%, a difference of 2.3%.
4 or more Vehicles in Household Correlation Summary
| Measurement | Canadian | Asian |
| Minimum | 4.3% | 0.45% |
| Maximum | 38.5% | 17.5% |
| Range | 34.1% | 17.0% |
| Mean | 14.4% | 7.9% |
| Median | 9.9% | 7.2% |
| Interquartile 25% (IQ1) | 7.3% | 6.4% |
| Interquartile 75% (IQ3) | 20.9% | 9.5% |
| Interquartile Range (IQR) | 13.6% | 3.0% |
| Standard Deviation (Sample) | 9.6% | 3.1% |
| Standard Deviation (Population) | 9.4% | 3.1% |
Demographics Similar to Canadians and Asians by 4 or more Vehicles in Household
In terms of 4 or more vehicles in household, the demographic groups most similar to Canadians are Bolivian (6.8%, a difference of 0.050%), Tlingit-Haida (6.8%, a difference of 0.11%), Immigrants from Guatemala (6.8%, a difference of 0.37%), Burmese (6.8%, a difference of 0.40%), and Hopi (6.9%, a difference of 0.42%). Similarly, the demographic groups most similar to Asians are Blackfeet (7.0%, a difference of 0.010%), Pakistani (7.0%, a difference of 0.070%), Taiwanese (7.0%, a difference of 0.14%), Seminole (7.0%, a difference of 0.21%), and Hmong (7.0%, a difference of 0.49%).
| Demographics | Rating | Rank | 4 or more Vehicles in Household |
| Celtics | 99.1 /100 | #97 | Exceptional 7.1% |
| Irish | 99.0 /100 | #98 | Exceptional 7.1% |
| Seminole | 98.8 /100 | #99 | Exceptional 7.0% |
| Taiwanese | 98.7 /100 | #100 | Exceptional 7.0% |
| Pakistanis | 98.7 /100 | #101 | Exceptional 7.0% |
| Asians | 98.6 /100 | #102 | Exceptional 7.0% |
| Blackfeet | 98.6 /100 | #103 | Exceptional 7.0% |
| Hmong | 98.3 /100 | #104 | Exceptional 7.0% |
| German Russians | 98.3 /100 | #105 | Exceptional 7.0% |
| Guatemalans | 98.1 /100 | #106 | Exceptional 7.0% |
| Nicaraguans | 98.0 /100 | #107 | Exceptional 7.0% |
| French | 97.7 /100 | #108 | Exceptional 6.9% |
| Filipinos | 97.6 /100 | #109 | Exceptional 6.9% |
| Immigrants | Thailand | 97.0 /100 | #110 | Exceptional 6.9% |
| Aleuts | 97.0 /100 | #111 | Exceptional 6.9% |
| Hopi | 97.0 /100 | #112 | Exceptional 6.9% |
| Canadians | 96.4 /100 | #113 | Exceptional 6.9% |
| Bolivians | 96.3 /100 | #114 | Exceptional 6.8% |
| Tlingit-Haida | 96.2 /100 | #115 | Exceptional 6.8% |
| Immigrants | Guatemala | 95.8 /100 | #116 | Exceptional 6.8% |
| Burmese | 95.7 /100 | #117 | Exceptional 6.8% |