Yakama vs Asian 4 or more Vehicles in Household
COMPARE
Yakama
Asian
4 or more Vehicles in Household
4 or more Vehicles in Household Comparison
Yakama
Asians
12.9%
4 OR MORE VEHICLES IN HOUSEHOLD
100/ 100
METRIC RATING
1st/ 347
METRIC RANK
7.0%
4 OR MORE VEHICLES IN HOUSEHOLD
98.6/ 100
METRIC RATING
102nd/ 347
METRIC RANK
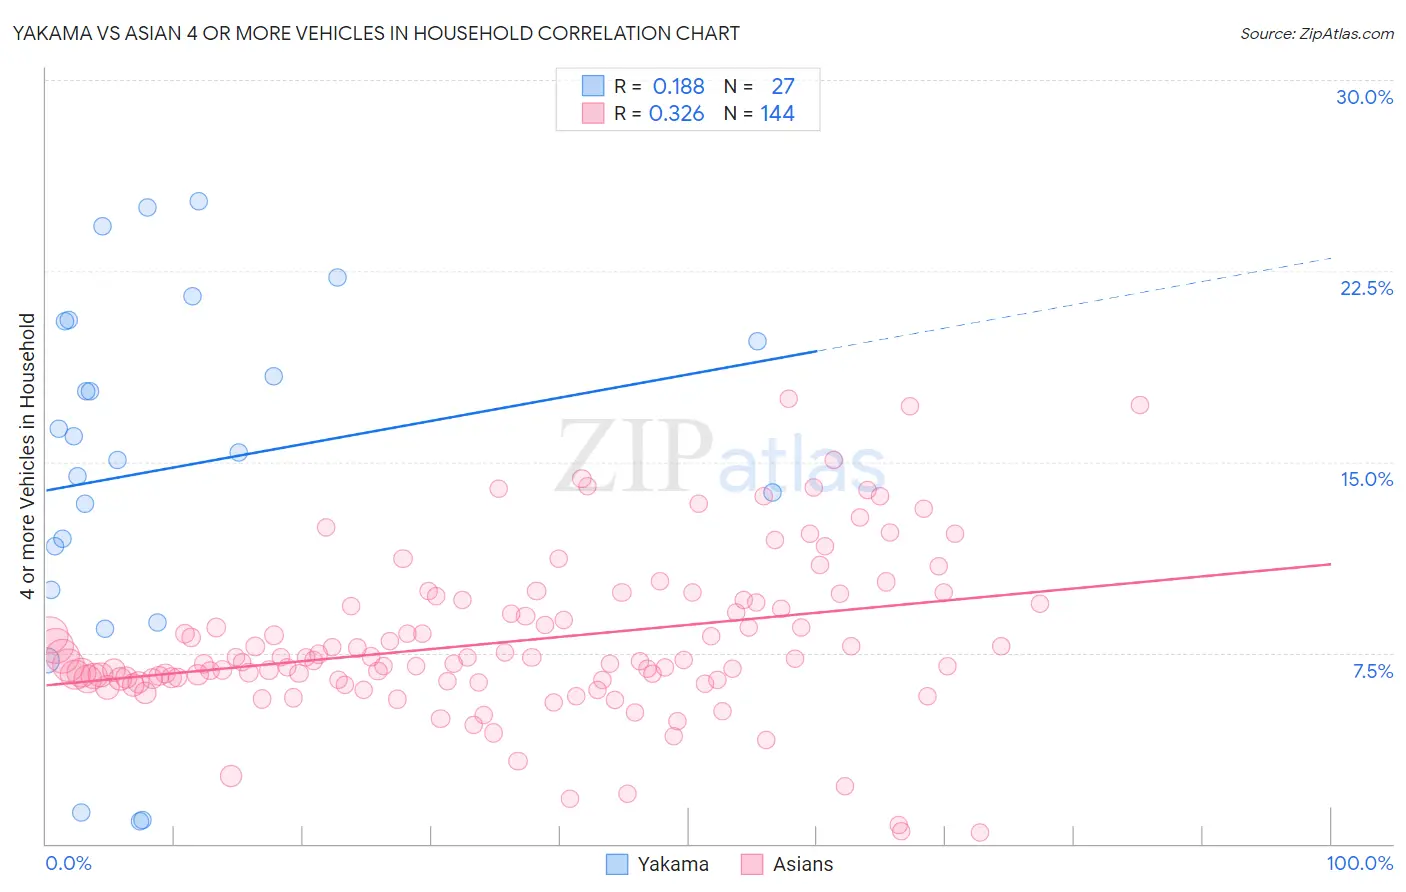
Yakama vs Asian 4 or more Vehicles in Household Correlation Chart
The statistical analysis conducted on geographies consisting of 19,917,241 people shows a poor positive correlation between the proportion of Yakama and percentage of households with 4 or more vehicles available in the United States with a correlation coefficient (R) of 0.188 and weighted average of 12.9%. Similarly, the statistical analysis conducted on geographies consisting of 547,642,894 people shows a mild positive correlation between the proportion of Asians and percentage of households with 4 or more vehicles available in the United States with a correlation coefficient (R) of 0.326 and weighted average of 7.0%, a difference of 84.5%.
4 or more Vehicles in Household Correlation Summary
| Measurement | Yakama | Asian |
| Minimum | 0.86% | 0.45% |
| Maximum | 25.2% | 17.5% |
| Range | 24.4% | 17.0% |
| Mean | 14.8% | 7.9% |
| Median | 15.4% | 7.2% |
| Interquartile 25% (IQ1) | 10.0% | 6.4% |
| Interquartile 75% (IQ3) | 20.5% | 9.5% |
| Interquartile Range (IQR) | 10.5% | 3.0% |
| Standard Deviation (Sample) | 7.0% | 3.1% |
| Standard Deviation (Population) | 6.9% | 3.1% |
Similar Demographics by 4 or more Vehicles in Household
Demographics Similar to Yakama by 4 or more Vehicles in Household
In terms of 4 or more vehicles in household, the demographic groups most similar to Yakama are Colville (11.1%, a difference of 16.1%), Spanish American Indian (10.8%, a difference of 20.1%), Tongan (10.0%, a difference of 28.9%), Immigrants from Fiji (9.6%, a difference of 34.4%), and Puget Sound Salish (9.4%, a difference of 37.8%).
| Demographics | Rating | Rank | 4 or more Vehicles in Household |
| Yakama | 100 /100 | #1 | Exceptional 12.9% |
| Colville | 100.0 /100 | #2 | Exceptional 11.1% |
| Spanish American Indians | 100.0 /100 | #3 | Exceptional 10.8% |
| Tongans | 100.0 /100 | #4 | Exceptional 10.0% |
| Immigrants | Fiji | 100.0 /100 | #5 | Exceptional 9.6% |
| Puget Sound Salish | 100.0 /100 | #6 | Exceptional 9.4% |
| Native Hawaiians | 100.0 /100 | #7 | Exceptional 9.4% |
| Arapaho | 100.0 /100 | #8 | Exceptional 9.4% |
| Samoans | 100.0 /100 | #9 | Exceptional 9.2% |
| Paiute | 100.0 /100 | #10 | Exceptional 9.0% |
| Immigrants | Mexico | 100.0 /100 | #11 | Exceptional 9.0% |
| Mexicans | 100.0 /100 | #12 | Exceptional 8.9% |
| Hawaiians | 100.0 /100 | #13 | Exceptional 8.9% |
| Chinese | 100.0 /100 | #14 | Exceptional 8.8% |
| Shoshone | 100.0 /100 | #15 | Exceptional 8.8% |
Demographics Similar to Asians by 4 or more Vehicles in Household
In terms of 4 or more vehicles in household, the demographic groups most similar to Asians are Blackfeet (7.0%, a difference of 0.010%), Pakistani (7.0%, a difference of 0.070%), Taiwanese (7.0%, a difference of 0.14%), Seminole (7.0%, a difference of 0.21%), and Hmong (7.0%, a difference of 0.49%).
| Demographics | Rating | Rank | 4 or more Vehicles in Household |
| Czechoslovakians | 99.3 /100 | #95 | Exceptional 7.1% |
| Central Americans | 99.3 /100 | #96 | Exceptional 7.1% |
| Celtics | 99.1 /100 | #97 | Exceptional 7.1% |
| Irish | 99.0 /100 | #98 | Exceptional 7.1% |
| Seminole | 98.8 /100 | #99 | Exceptional 7.0% |
| Taiwanese | 98.7 /100 | #100 | Exceptional 7.0% |
| Pakistanis | 98.7 /100 | #101 | Exceptional 7.0% |
| Asians | 98.6 /100 | #102 | Exceptional 7.0% |
| Blackfeet | 98.6 /100 | #103 | Exceptional 7.0% |
| Hmong | 98.3 /100 | #104 | Exceptional 7.0% |
| German Russians | 98.3 /100 | #105 | Exceptional 7.0% |
| Guatemalans | 98.1 /100 | #106 | Exceptional 7.0% |
| Nicaraguans | 98.0 /100 | #107 | Exceptional 7.0% |
| French | 97.7 /100 | #108 | Exceptional 6.9% |
| Filipinos | 97.6 /100 | #109 | Exceptional 6.9% |