Cypriot vs Colville 2 or more Vehicles in Household
COMPARE
Cypriot
Colville
2 or more Vehicles in Household
2 or more Vehicles in Household Comparison
Cypriots
Colville
50.6%
2 OR MORE VEHICLES IN HOUSEHOLD
0.0/ 100
METRIC RATING
295th/ 347
METRIC RANK
55.6%
2 OR MORE VEHICLES IN HOUSEHOLD
61.1/ 100
METRIC RATING
161st/ 347
METRIC RANK
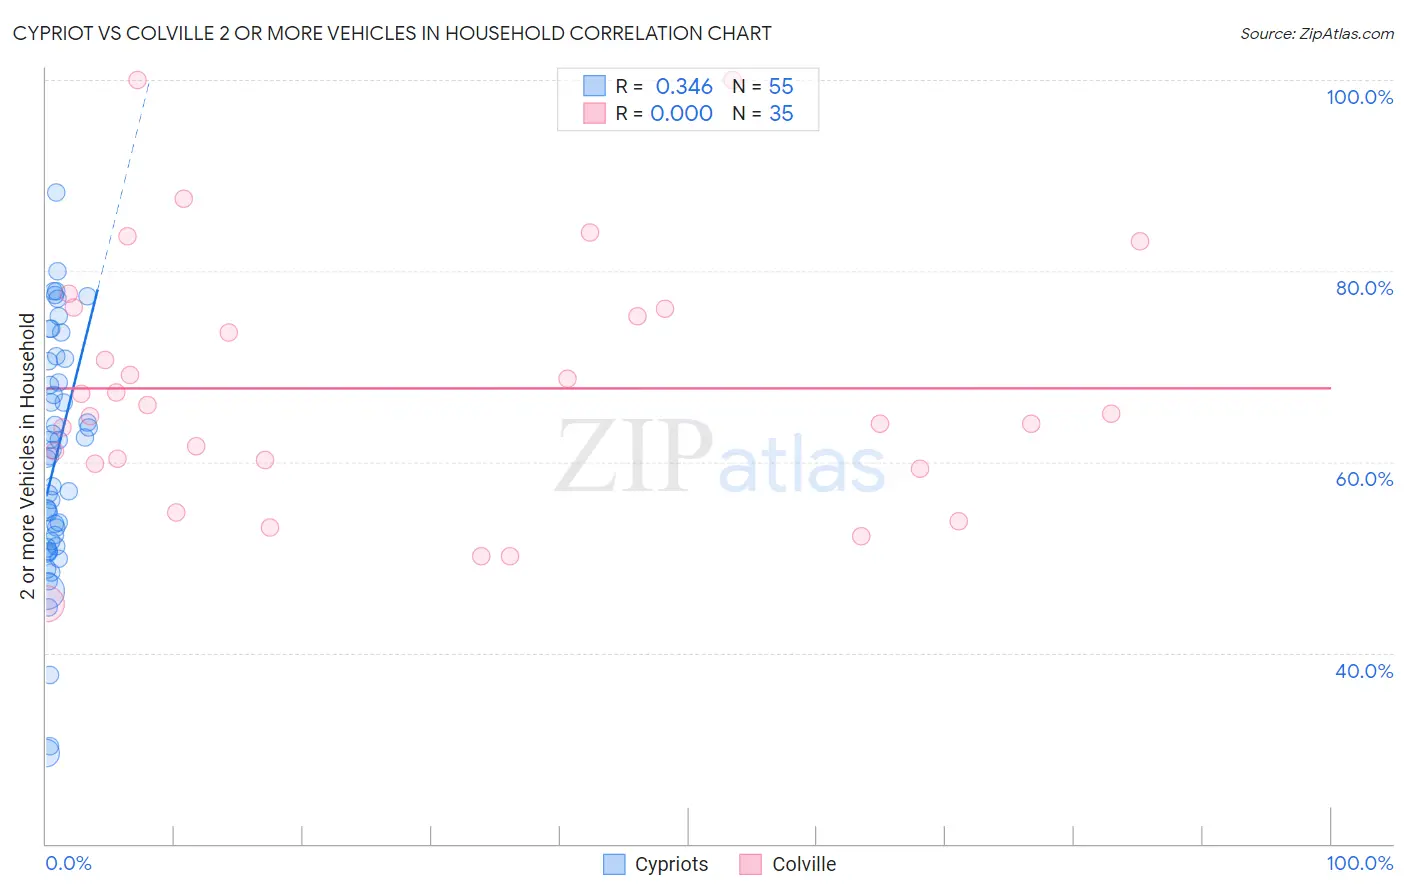
Cypriot vs Colville 2 or more Vehicles in Household Correlation Chart
The statistical analysis conducted on geographies consisting of 61,854,678 people shows a mild positive correlation between the proportion of Cypriots and percentage of households with 2 or more vehicles available in the United States with a correlation coefficient (R) of 0.346 and weighted average of 50.6%. Similarly, the statistical analysis conducted on geographies consisting of 34,683,092 people shows no correlation between the proportion of Colville and percentage of households with 2 or more vehicles available in the United States with a correlation coefficient (R) of 0.000 and weighted average of 55.6%, a difference of 10.0%.
2 or more Vehicles in Household Correlation Summary
| Measurement | Cypriot | Colville |
| Minimum | 29.5% | 45.2% |
| Maximum | 88.3% | 100.0% |
| Range | 58.8% | 54.8% |
| Mean | 60.3% | 67.7% |
| Median | 60.5% | 65.0% |
| Interquartile 25% (IQ1) | 51.1% | 59.8% |
| Interquartile 75% (IQ3) | 70.5% | 76.1% |
| Interquartile Range (IQR) | 19.4% | 16.3% |
| Standard Deviation (Sample) | 12.4% | 13.2% |
| Standard Deviation (Population) | 12.3% | 13.0% |
Similar Demographics by 2 or more Vehicles in Household
Demographics Similar to Cypriots by 2 or more Vehicles in Household
In terms of 2 or more vehicles in household, the demographic groups most similar to Cypriots are Immigrants from Somalia (50.5%, a difference of 0.040%), Bermudan (50.6%, a difference of 0.070%), Immigrants from Spain (50.4%, a difference of 0.31%), Paraguayan (50.3%, a difference of 0.44%), and Immigrants from Morocco (50.3%, a difference of 0.47%).
| Demographics | Rating | Rank | 2 or more Vehicles in Household |
| Okinawans | 0.1 /100 | #288 | Tragic 51.2% |
| Somalis | 0.0 /100 | #289 | Tragic 51.1% |
| Immigrants | Panama | 0.0 /100 | #290 | Tragic 51.1% |
| Belizeans | 0.0 /100 | #291 | Tragic 51.0% |
| Immigrants | Ukraine | 0.0 /100 | #292 | Tragic 50.9% |
| Blacks/African Americans | 0.0 /100 | #293 | Tragic 50.9% |
| Bermudans | 0.0 /100 | #294 | Tragic 50.6% |
| Cypriots | 0.0 /100 | #295 | Tragic 50.6% |
| Immigrants | Somalia | 0.0 /100 | #296 | Tragic 50.5% |
| Immigrants | Spain | 0.0 /100 | #297 | Tragic 50.4% |
| Paraguayans | 0.0 /100 | #298 | Tragic 50.3% |
| Immigrants | Morocco | 0.0 /100 | #299 | Tragic 50.3% |
| Immigrants | Russia | 0.0 /100 | #300 | Tragic 50.3% |
| Immigrants | Greece | 0.0 /100 | #301 | Tragic 50.2% |
| Immigrants | South America | 0.0 /100 | #302 | Tragic 50.2% |
Demographics Similar to Colville by 2 or more Vehicles in Household
In terms of 2 or more vehicles in household, the demographic groups most similar to Colville are German Russian (55.6%, a difference of 0.010%), Immigrants from Zimbabwe (55.6%, a difference of 0.040%), Dutch West Indian (55.6%, a difference of 0.050%), Immigrants from El Salvador (55.6%, a difference of 0.070%), and Immigrants from Sri Lanka (55.5%, a difference of 0.12%).
| Demographics | Rating | Rank | 2 or more Vehicles in Household |
| Ukrainians | 70.8 /100 | #154 | Good 55.8% |
| Immigrants | Venezuela | 70.7 /100 | #155 | Good 55.8% |
| Immigrants | Lithuania | 70.4 /100 | #156 | Good 55.8% |
| Immigrants | Kuwait | 70.2 /100 | #157 | Good 55.8% |
| Tlingit-Haida | 68.5 /100 | #158 | Good 55.8% |
| Paiute | 68.0 /100 | #159 | Good 55.8% |
| Crow | 67.0 /100 | #160 | Good 55.7% |
| Colville | 61.1 /100 | #161 | Good 55.6% |
| German Russians | 60.9 /100 | #162 | Good 55.6% |
| Immigrants | Zimbabwe | 60.2 /100 | #163 | Good 55.6% |
| Dutch West Indians | 59.8 /100 | #164 | Average 55.6% |
| Immigrants | El Salvador | 59.4 /100 | #165 | Average 55.6% |
| Immigrants | Sri Lanka | 58.3 /100 | #166 | Average 55.5% |
| Kenyans | 58.1 /100 | #167 | Average 55.5% |
| French American Indians | 56.7 /100 | #168 | Average 55.5% |