Cypriot vs Native/Alaskan 2 or more Vehicles in Household
COMPARE
Cypriot
Native/Alaskan
2 or more Vehicles in Household
2 or more Vehicles in Household Comparison
Cypriots
Natives/Alaskans
50.6%
2 OR MORE VEHICLES IN HOUSEHOLD
0.0/ 100
METRIC RATING
295th/ 347
METRIC RANK
57.0%
2 OR MORE VEHICLES IN HOUSEHOLD
95.0/ 100
METRIC RATING
119th/ 347
METRIC RANK
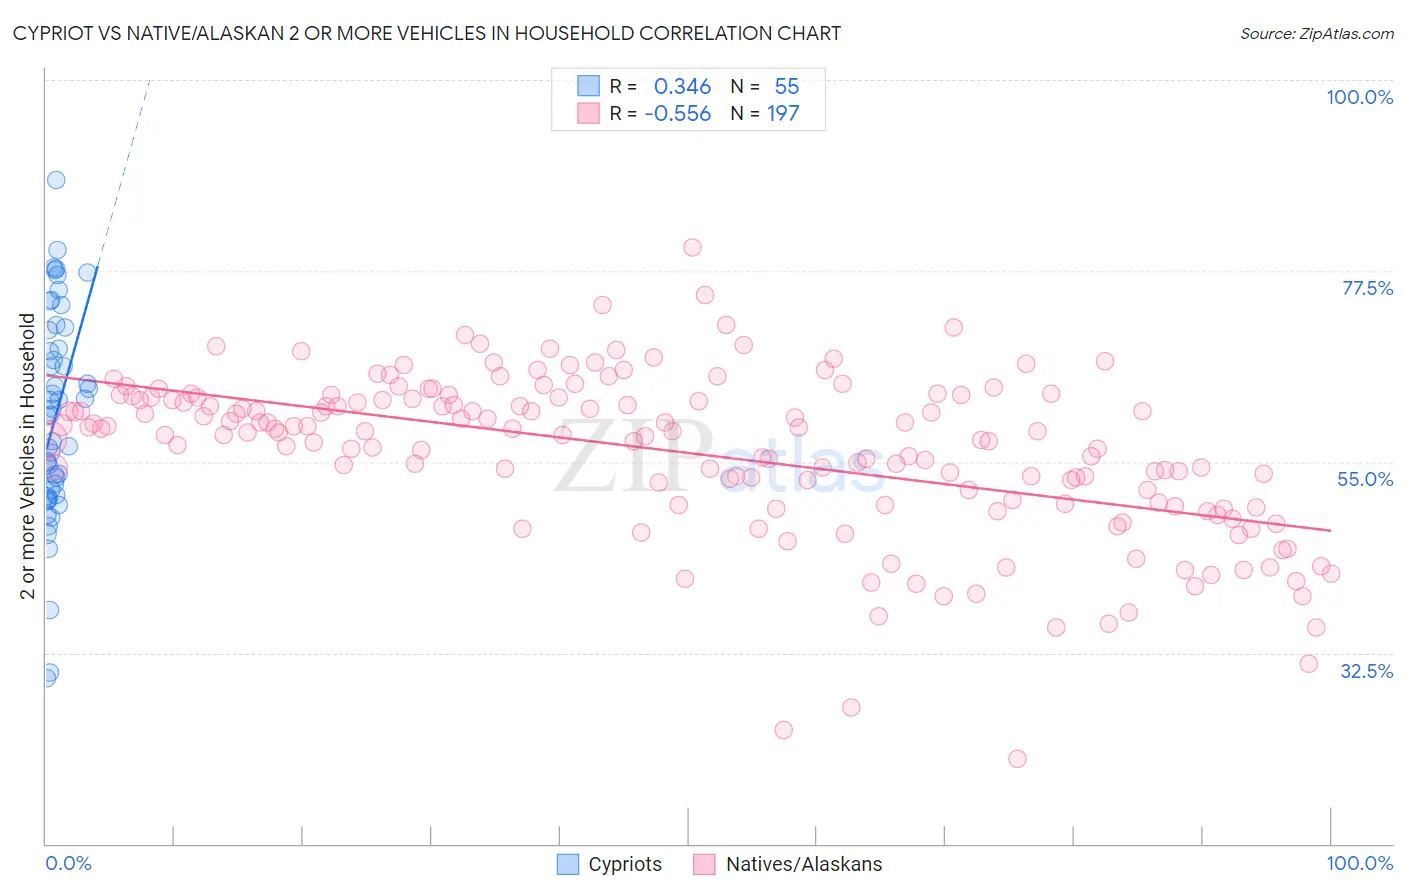
Cypriot vs Native/Alaskan 2 or more Vehicles in Household Correlation Chart
The statistical analysis conducted on geographies consisting of 61,854,678 people shows a mild positive correlation between the proportion of Cypriots and percentage of households with 2 or more vehicles available in the United States with a correlation coefficient (R) of 0.346 and weighted average of 50.6%. Similarly, the statistical analysis conducted on geographies consisting of 512,668,217 people shows a substantial negative correlation between the proportion of Natives/Alaskans and percentage of households with 2 or more vehicles available in the United States with a correlation coefficient (R) of -0.556 and weighted average of 57.0%, a difference of 12.7%.
2 or more Vehicles in Household Correlation Summary
| Measurement | Cypriot | Native/Alaskan |
| Minimum | 29.5% | 20.0% |
| Maximum | 88.3% | 80.2% |
| Range | 58.8% | 60.2% |
| Mean | 60.3% | 56.1% |
| Median | 60.5% | 58.5% |
| Interquartile 25% (IQ1) | 51.1% | 50.1% |
| Interquartile 75% (IQ3) | 70.5% | 62.5% |
| Interquartile Range (IQR) | 19.4% | 12.4% |
| Standard Deviation (Sample) | 12.4% | 9.6% |
| Standard Deviation (Population) | 12.3% | 9.6% |
Similar Demographics by 2 or more Vehicles in Household
Demographics Similar to Cypriots by 2 or more Vehicles in Household
In terms of 2 or more vehicles in household, the demographic groups most similar to Cypriots are Immigrants from Somalia (50.5%, a difference of 0.040%), Bermudan (50.6%, a difference of 0.070%), Immigrants from Spain (50.4%, a difference of 0.31%), Paraguayan (50.3%, a difference of 0.44%), and Immigrants from Morocco (50.3%, a difference of 0.47%).
| Demographics | Rating | Rank | 2 or more Vehicles in Household |
| Okinawans | 0.1 /100 | #288 | Tragic 51.2% |
| Somalis | 0.0 /100 | #289 | Tragic 51.1% |
| Immigrants | Panama | 0.0 /100 | #290 | Tragic 51.1% |
| Belizeans | 0.0 /100 | #291 | Tragic 51.0% |
| Immigrants | Ukraine | 0.0 /100 | #292 | Tragic 50.9% |
| Blacks/African Americans | 0.0 /100 | #293 | Tragic 50.9% |
| Bermudans | 0.0 /100 | #294 | Tragic 50.6% |
| Cypriots | 0.0 /100 | #295 | Tragic 50.6% |
| Immigrants | Somalia | 0.0 /100 | #296 | Tragic 50.5% |
| Immigrants | Spain | 0.0 /100 | #297 | Tragic 50.4% |
| Paraguayans | 0.0 /100 | #298 | Tragic 50.3% |
| Immigrants | Morocco | 0.0 /100 | #299 | Tragic 50.3% |
| Immigrants | Russia | 0.0 /100 | #300 | Tragic 50.3% |
| Immigrants | Greece | 0.0 /100 | #301 | Tragic 50.2% |
| Immigrants | South America | 0.0 /100 | #302 | Tragic 50.2% |
Demographics Similar to Natives/Alaskans by 2 or more Vehicles in Household
In terms of 2 or more vehicles in household, the demographic groups most similar to Natives/Alaskans are Asian (57.0%, a difference of 0.030%), Costa Rican (56.9%, a difference of 0.050%), Iraqi (57.1%, a difference of 0.19%), Sioux (56.8%, a difference of 0.21%), and Immigrants from Jordan (57.2%, a difference of 0.38%).
| Demographics | Rating | Rank | 2 or more Vehicles in Household |
| Pueblo | 98.0 /100 | #112 | Exceptional 57.5% |
| Zimbabweans | 96.9 /100 | #113 | Exceptional 57.2% |
| Immigrants | Lebanon | 96.8 /100 | #114 | Exceptional 57.2% |
| Chippewa | 96.6 /100 | #115 | Exceptional 57.2% |
| Immigrants | Jordan | 96.6 /100 | #116 | Exceptional 57.2% |
| Iraqis | 95.8 /100 | #117 | Exceptional 57.1% |
| Asians | 95.1 /100 | #118 | Exceptional 57.0% |
| Natives/Alaskans | 95.0 /100 | #119 | Exceptional 57.0% |
| Costa Ricans | 94.7 /100 | #120 | Exceptional 56.9% |
| Sioux | 93.8 /100 | #121 | Exceptional 56.8% |
| Immigrants | South Africa | 92.5 /100 | #122 | Exceptional 56.7% |
| Australians | 91.8 /100 | #123 | Exceptional 56.7% |
| New Zealanders | 91.8 /100 | #124 | Exceptional 56.7% |
| Tsimshian | 91.6 /100 | #125 | Exceptional 56.7% |
| Estonians | 90.9 /100 | #126 | Exceptional 56.6% |