Cypriot vs South African In Labor Force | Age 20-64
COMPARE
Cypriot
South African
In Labor Force | Age 20-64
In Labor Force | Age 20-64 Comparison
Cypriots
South Africans
80.2%
IN LABOR FORCE | AGE 20-64
98.2/ 100
METRIC RATING
73rd/ 347
METRIC RANK
79.7%
IN LABOR FORCE | AGE 20-64
66.2/ 100
METRIC RATING
161st/ 347
METRIC RANK
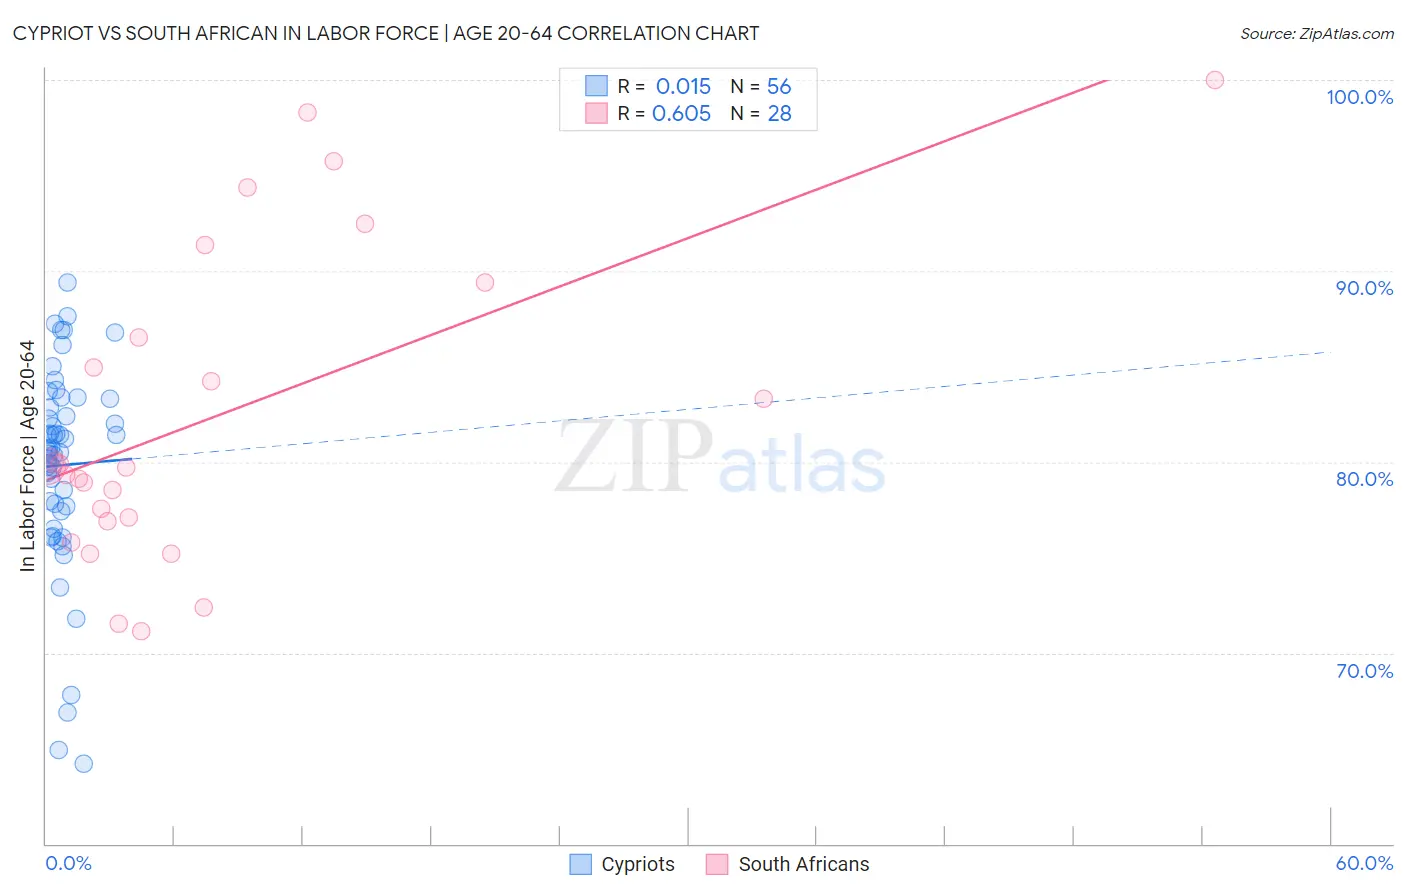
Cypriot vs South African In Labor Force | Age 20-64 Correlation Chart
The statistical analysis conducted on geographies consisting of 61,869,277 people shows no correlation between the proportion of Cypriots and labor force participation rate among population between the ages 20 and 64 in the United States with a correlation coefficient (R) of 0.015 and weighted average of 80.2%. Similarly, the statistical analysis conducted on geographies consisting of 182,600,467 people shows a significant positive correlation between the proportion of South Africans and labor force participation rate among population between the ages 20 and 64 in the United States with a correlation coefficient (R) of 0.605 and weighted average of 79.7%, a difference of 0.66%.
In Labor Force | Age 20-64 Correlation Summary
| Measurement | Cypriot | South African |
| Minimum | 64.2% | 71.1% |
| Maximum | 89.4% | 100.0% |
| Range | 25.2% | 28.9% |
| Mean | 79.8% | 82.4% |
| Median | 80.7% | 79.7% |
| Interquartile 25% (IQ1) | 77.5% | 77.0% |
| Interquartile 75% (IQ3) | 83.1% | 88.0% |
| Interquartile Range (IQR) | 5.5% | 11.0% |
| Standard Deviation (Sample) | 5.4% | 8.1% |
| Standard Deviation (Population) | 5.3% | 8.0% |
Similar Demographics by In Labor Force | Age 20-64
Demographics Similar to Cypriots by In Labor Force | Age 20-64
In terms of in labor force | age 20-64, the demographic groups most similar to Cypriots are Immigrants from Eastern Europe (80.2%, a difference of 0.010%), Immigrants from Afghanistan (80.2%, a difference of 0.020%), Eastern European (80.2%, a difference of 0.030%), Immigrants from Turkey (80.2%, a difference of 0.040%), and Soviet Union (80.2%, a difference of 0.040%).
| Demographics | Rating | Rank | In Labor Force | Age 20-64 |
| Macedonians | 98.7 /100 | #66 | Exceptional 80.2% |
| Taiwanese | 98.6 /100 | #67 | Exceptional 80.2% |
| Bhutanese | 98.6 /100 | #68 | Exceptional 80.2% |
| Albanians | 98.6 /100 | #69 | Exceptional 80.2% |
| Immigrants | Turkey | 98.5 /100 | #70 | Exceptional 80.2% |
| Soviet Union | 98.5 /100 | #71 | Exceptional 80.2% |
| Eastern Europeans | 98.4 /100 | #72 | Exceptional 80.2% |
| Cypriots | 98.2 /100 | #73 | Exceptional 80.2% |
| Immigrants | Eastern Europe | 98.1 /100 | #74 | Exceptional 80.2% |
| Immigrants | Afghanistan | 97.9 /100 | #75 | Exceptional 80.2% |
| Egyptians | 97.8 /100 | #76 | Exceptional 80.2% |
| Immigrants | Colombia | 97.8 /100 | #77 | Exceptional 80.2% |
| Immigrants | Romania | 97.8 /100 | #78 | Exceptional 80.2% |
| Asians | 97.7 /100 | #79 | Exceptional 80.2% |
| Immigrants | Croatia | 97.6 /100 | #80 | Exceptional 80.1% |
Demographics Similar to South Africans by In Labor Force | Age 20-64
In terms of in labor force | age 20-64, the demographic groups most similar to South Africans are Immigrants from Cuba (79.7%, a difference of 0.0%), Moroccan (79.7%, a difference of 0.0%), Austrian (79.7%, a difference of 0.010%), German (79.7%, a difference of 0.010%), and Immigrants from Costa Rica (79.7%, a difference of 0.010%).
| Demographics | Rating | Rank | In Labor Force | Age 20-64 |
| New Zealanders | 69.4 /100 | #154 | Good 79.7% |
| Immigrants | South Africa | 69.2 /100 | #155 | Good 79.7% |
| Senegalese | 69.1 /100 | #156 | Good 79.7% |
| Immigrants | China | 69.1 /100 | #157 | Good 79.7% |
| Austrians | 67.6 /100 | #158 | Good 79.7% |
| Immigrants | Cuba | 66.7 /100 | #159 | Good 79.7% |
| Moroccans | 66.7 /100 | #160 | Good 79.7% |
| South Africans | 66.2 /100 | #161 | Good 79.7% |
| Germans | 65.2 /100 | #162 | Good 79.7% |
| Immigrants | Costa Rica | 64.6 /100 | #163 | Good 79.7% |
| Immigrants | Burma/Myanmar | 64.4 /100 | #164 | Good 79.7% |
| Nigerians | 64.0 /100 | #165 | Good 79.7% |
| Okinawans | 62.7 /100 | #166 | Good 79.6% |
| Immigrants | Iraq | 62.0 /100 | #167 | Good 79.6% |
| Immigrants | Indonesia | 61.8 /100 | #168 | Good 79.6% |