Cypriot vs South African Median Earnings
COMPARE
Cypriot
South African
Median Earnings
Median Earnings Comparison
Cypriots
South Africans
$54,589
MEDIAN EARNINGS
100.0/ 100
METRIC RATING
20th/ 347
METRIC RANK
$50,752
MEDIAN EARNINGS
99.8/ 100
METRIC RATING
74th/ 347
METRIC RANK
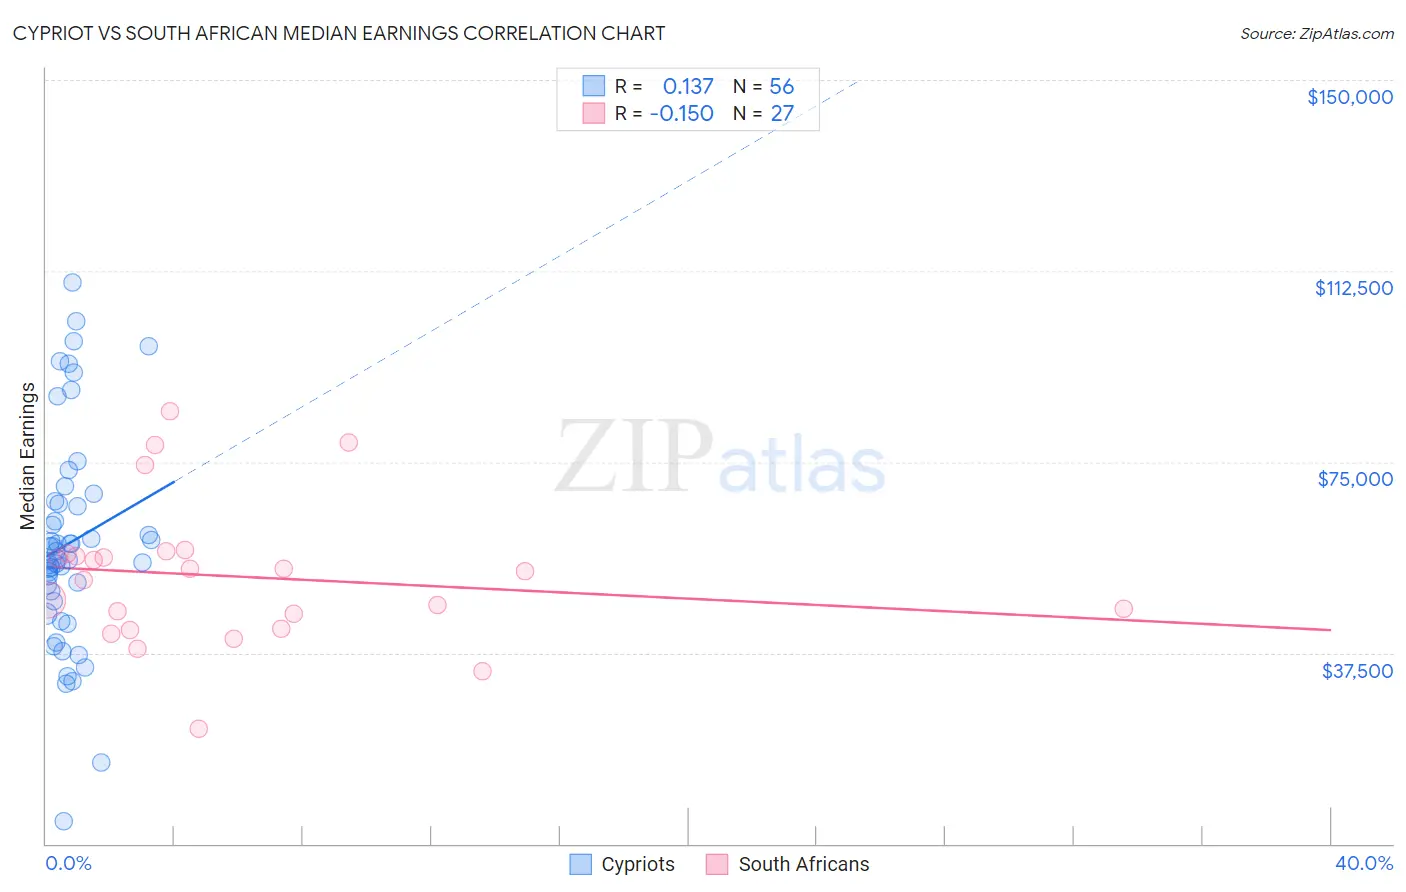
Cypriot vs South African Median Earnings Correlation Chart
The statistical analysis conducted on geographies consisting of 61,853,771 people shows a poor positive correlation between the proportion of Cypriots and median earnings in the United States with a correlation coefficient (R) of 0.137 and weighted average of $54,589. Similarly, the statistical analysis conducted on geographies consisting of 182,600,845 people shows a poor negative correlation between the proportion of South Africans and median earnings in the United States with a correlation coefficient (R) of -0.150 and weighted average of $50,752, a difference of 7.6%.
Median Earnings Correlation Summary
| Measurement | Cypriot | South African |
| Minimum | $4,333 | $22,500 |
| Maximum | $110,295 | $84,919 |
| Range | $105,962 | $62,419 |
| Mean | $59,088 | $52,531 |
| Median | $56,710 | $53,417 |
| Interquartile 25% (IQ1) | $48,668 | $42,247 |
| Interquartile 75% (IQ3) | $66,958 | $56,939 |
| Interquartile Range (IQR) | $18,291 | $14,692 |
| Standard Deviation (Sample) | $21,103 | $14,077 |
| Standard Deviation (Population) | $20,914 | $13,814 |
Similar Demographics by Median Earnings
Demographics Similar to Cypriots by Median Earnings
In terms of median earnings, the demographic groups most similar to Cypriots are Burmese ($54,559, a difference of 0.060%), Immigrants from Korea ($54,530, a difference of 0.11%), Immigrants from Belgium ($54,679, a difference of 0.16%), Immigrants from Sweden ($54,478, a difference of 0.20%), and Soviet Union ($54,290, a difference of 0.55%).
| Demographics | Rating | Rank | Median Earnings |
| Immigrants | China | 100.0 /100 | #13 | Exceptional $56,638 |
| Immigrants | Australia | 100.0 /100 | #14 | Exceptional $56,305 |
| Indians (Asian) | 100.0 /100 | #15 | Exceptional $56,253 |
| Immigrants | Eastern Asia | 100.0 /100 | #16 | Exceptional $56,183 |
| Eastern Europeans | 100.0 /100 | #17 | Exceptional $55,084 |
| Immigrants | Japan | 100.0 /100 | #18 | Exceptional $54,938 |
| Immigrants | Belgium | 100.0 /100 | #19 | Exceptional $54,679 |
| Cypriots | 100.0 /100 | #20 | Exceptional $54,589 |
| Burmese | 100.0 /100 | #21 | Exceptional $54,559 |
| Immigrants | Korea | 100.0 /100 | #22 | Exceptional $54,530 |
| Immigrants | Sweden | 100.0 /100 | #23 | Exceptional $54,478 |
| Soviet Union | 100.0 /100 | #24 | Exceptional $54,290 |
| Turks | 100.0 /100 | #25 | Exceptional $53,919 |
| Immigrants | Northern Europe | 100.0 /100 | #26 | Exceptional $53,872 |
| Asians | 100.0 /100 | #27 | Exceptional $53,690 |
Demographics Similar to South Africans by Median Earnings
In terms of median earnings, the demographic groups most similar to South Africans are Immigrants from Scotland ($50,741, a difference of 0.020%), Immigrants from Netherlands ($50,818, a difference of 0.13%), Immigrants from Egypt ($50,901, a difference of 0.29%), Immigrants from Italy ($50,581, a difference of 0.34%), and Immigrants from Western Europe ($50,549, a difference of 0.40%).
| Demographics | Rating | Rank | Median Earnings |
| Immigrants | Spain | 99.9 /100 | #67 | Exceptional $51,092 |
| Paraguayans | 99.9 /100 | #68 | Exceptional $51,068 |
| Mongolians | 99.8 /100 | #69 | Exceptional $51,038 |
| Lithuanians | 99.8 /100 | #70 | Exceptional $50,991 |
| Immigrants | Ukraine | 99.8 /100 | #71 | Exceptional $50,984 |
| Immigrants | Egypt | 99.8 /100 | #72 | Exceptional $50,901 |
| Immigrants | Netherlands | 99.8 /100 | #73 | Exceptional $50,818 |
| South Africans | 99.8 /100 | #74 | Exceptional $50,752 |
| Immigrants | Scotland | 99.8 /100 | #75 | Exceptional $50,741 |
| Immigrants | Italy | 99.7 /100 | #76 | Exceptional $50,581 |
| Immigrants | Western Europe | 99.7 /100 | #77 | Exceptional $50,549 |
| Argentineans | 99.6 /100 | #78 | Exceptional $50,399 |
| Laotians | 99.6 /100 | #79 | Exceptional $50,343 |
| Ukrainians | 99.6 /100 | #80 | Exceptional $50,320 |
| Immigrants | Southern Europe | 99.6 /100 | #81 | Exceptional $50,280 |