Croatian vs Immigrants from Yemen Per Capita Income
COMPARE
Croatian
Immigrants from Yemen
Per Capita Income
Per Capita Income Comparison
Croatians
Immigrants from Yemen
$47,742
PER CAPITA INCOME
99.0/ 100
METRIC RATING
88th/ 347
METRIC RANK
$33,696
PER CAPITA INCOME
0.0/ 100
METRIC RATING
333rd/ 347
METRIC RANK
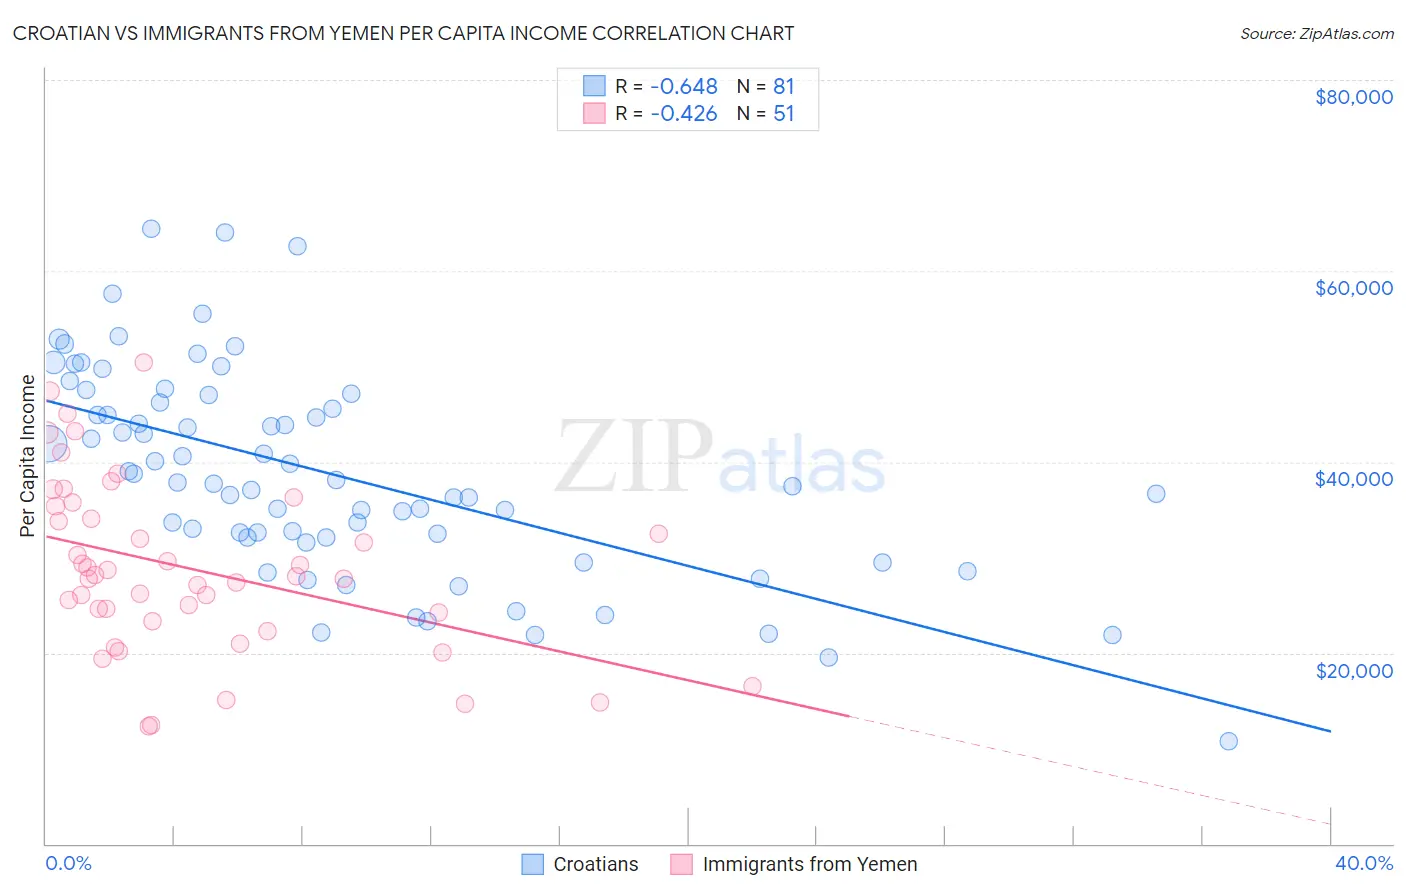
Croatian vs Immigrants from Yemen Per Capita Income Correlation Chart
The statistical analysis conducted on geographies consisting of 375,755,176 people shows a significant negative correlation between the proportion of Croatians and per capita income in the United States with a correlation coefficient (R) of -0.648 and weighted average of $47,742. Similarly, the statistical analysis conducted on geographies consisting of 82,433,611 people shows a moderate negative correlation between the proportion of Immigrants from Yemen and per capita income in the United States with a correlation coefficient (R) of -0.426 and weighted average of $33,696, a difference of 41.7%.
Per Capita Income Correlation Summary
| Measurement | Croatian | Immigrants from Yemen |
| Minimum | $10,765 | $12,331 |
| Maximum | $64,427 | $50,453 |
| Range | $53,662 | $38,122 |
| Mean | $38,757 | $28,807 |
| Median | $37,830 | $28,035 |
| Interquartile 25% (IQ1) | $32,092 | $23,368 |
| Interquartile 75% (IQ3) | $46,598 | $35,374 |
| Interquartile Range (IQR) | $14,505 | $12,006 |
| Standard Deviation (Sample) | $10,847 | $8,972 |
| Standard Deviation (Population) | $10,780 | $8,883 |
Similar Demographics by Per Capita Income
Demographics Similar to Croatians by Per Capita Income
In terms of per capita income, the demographic groups most similar to Croatians are Northern European ($47,698, a difference of 0.090%), Italian ($47,574, a difference of 0.35%), Macedonian ($47,573, a difference of 0.36%), Immigrants from Moldova ($47,489, a difference of 0.53%), and Ukrainian ($48,014, a difference of 0.57%).
| Demographics | Rating | Rank | Per Capita Income |
| Armenians | 99.4 /100 | #81 | Exceptional $48,287 |
| Immigrants | Indonesia | 99.4 /100 | #82 | Exceptional $48,195 |
| Immigrants | Brazil | 99.4 /100 | #83 | Exceptional $48,164 |
| Immigrants | Ukraine | 99.3 /100 | #84 | Exceptional $48,134 |
| Austrians | 99.3 /100 | #85 | Exceptional $48,116 |
| Immigrants | Southern Europe | 99.3 /100 | #86 | Exceptional $48,027 |
| Ukrainians | 99.3 /100 | #87 | Exceptional $48,014 |
| Croatians | 99.0 /100 | #88 | Exceptional $47,742 |
| Northern Europeans | 98.9 /100 | #89 | Exceptional $47,698 |
| Italians | 98.8 /100 | #90 | Exceptional $47,574 |
| Macedonians | 98.8 /100 | #91 | Exceptional $47,573 |
| Immigrants | Moldova | 98.7 /100 | #92 | Exceptional $47,489 |
| Immigrants | Zimbabwe | 98.5 /100 | #93 | Exceptional $47,394 |
| Albanians | 98.5 /100 | #94 | Exceptional $47,379 |
| Immigrants | Egypt | 98.5 /100 | #95 | Exceptional $47,361 |
Demographics Similar to Immigrants from Yemen by Per Capita Income
In terms of per capita income, the demographic groups most similar to Immigrants from Yemen are Sioux ($33,921, a difference of 0.67%), Immigrants from Mexico ($33,931, a difference of 0.70%), Native/Alaskan ($33,279, a difference of 1.3%), Yuman ($33,236, a difference of 1.4%), and Spanish American Indian ($34,195, a difference of 1.5%).
| Demographics | Rating | Rank | Per Capita Income |
| Immigrants | Cuba | 0.0 /100 | #326 | Tragic $34,910 |
| Apache | 0.0 /100 | #327 | Tragic $34,886 |
| Menominee | 0.0 /100 | #328 | Tragic $34,578 |
| Mexicans | 0.0 /100 | #329 | Tragic $34,559 |
| Spanish American Indians | 0.0 /100 | #330 | Tragic $34,195 |
| Immigrants | Mexico | 0.0 /100 | #331 | Tragic $33,931 |
| Sioux | 0.0 /100 | #332 | Tragic $33,921 |
| Immigrants | Yemen | 0.0 /100 | #333 | Tragic $33,696 |
| Natives/Alaskans | 0.0 /100 | #334 | Tragic $33,279 |
| Yuman | 0.0 /100 | #335 | Tragic $33,236 |
| Yakama | 0.0 /100 | #336 | Tragic $33,009 |
| Houma | 0.0 /100 | #337 | Tragic $32,996 |
| Arapaho | 0.0 /100 | #338 | Tragic $32,345 |
| Pueblo | 0.0 /100 | #339 | Tragic $32,012 |
| Crow | 0.0 /100 | #340 | Tragic $31,729 |