Creek vs Immigrants from South Eastern Asia 3 or more Vehicles in Household
COMPARE
Creek
Immigrants from South Eastern Asia
3 or more Vehicles in Household
3 or more Vehicles in Household Comparison
Creek
Immigrants from South Eastern Asia
21.9%
3 OR MORE VEHICLES IN HOUSEHOLD
99.9/ 100
METRIC RATING
69th/ 347
METRIC RANK
23.1%
3 OR MORE VEHICLES IN HOUSEHOLD
100.0/ 100
METRIC RATING
30th/ 347
METRIC RANK
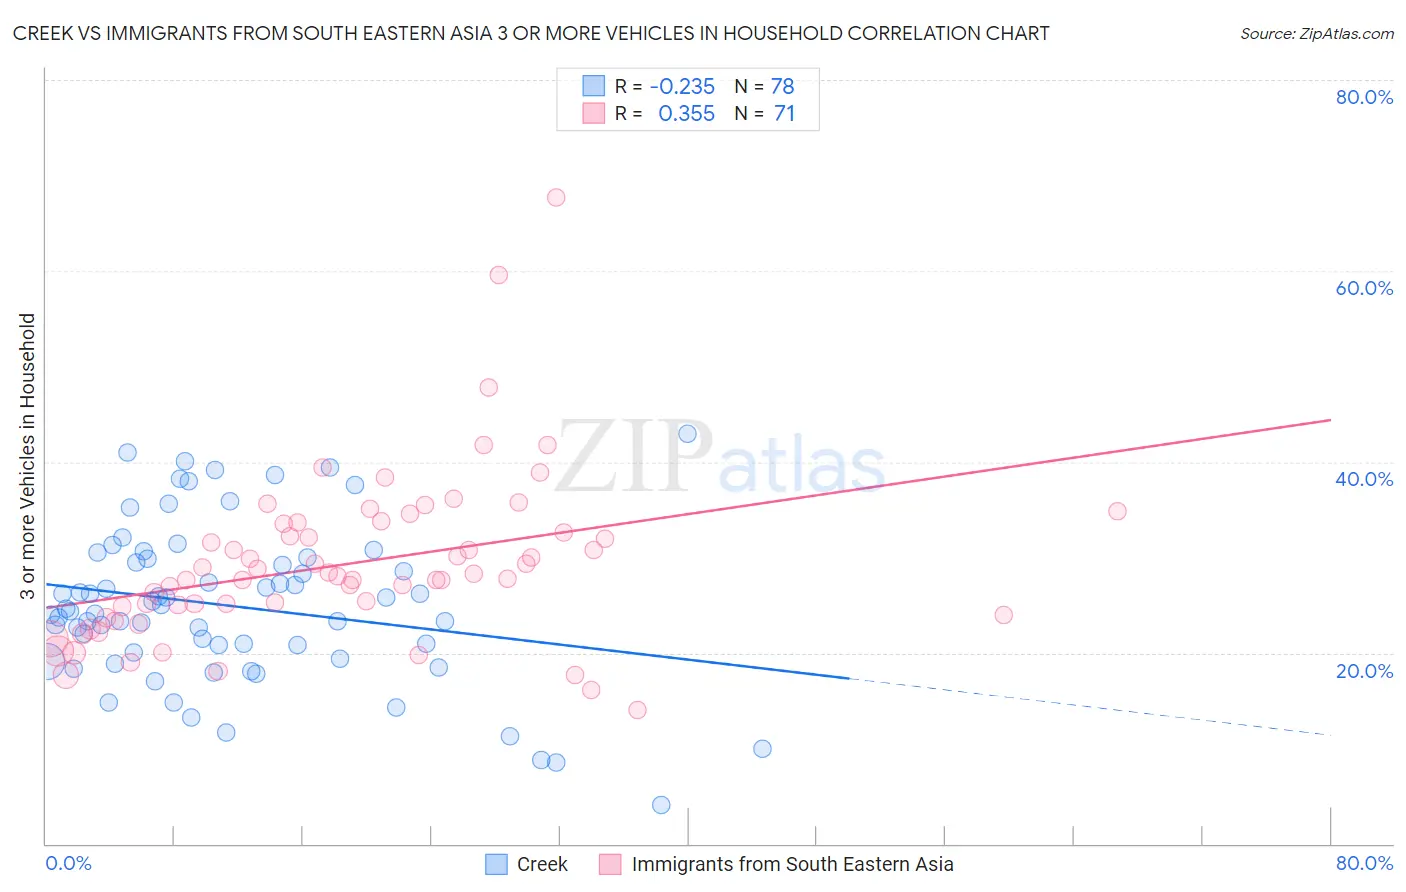
Creek vs Immigrants from South Eastern Asia 3 or more Vehicles in Household Correlation Chart
The statistical analysis conducted on geographies consisting of 178,435,403 people shows a weak negative correlation between the proportion of Creek and percentage of households with 3 or more vehicles available in the United States with a correlation coefficient (R) of -0.235 and weighted average of 21.9%. Similarly, the statistical analysis conducted on geographies consisting of 512,036,207 people shows a mild positive correlation between the proportion of Immigrants from South Eastern Asia and percentage of households with 3 or more vehicles available in the United States with a correlation coefficient (R) of 0.355 and weighted average of 23.1%, a difference of 5.4%.
3 or more Vehicles in Household Correlation Summary
| Measurement | Creek | Immigrants from South Eastern Asia |
| Minimum | 4.1% | 14.1% |
| Maximum | 43.0% | 67.7% |
| Range | 38.9% | 53.6% |
| Mean | 24.9% | 29.3% |
| Median | 24.5% | 28.1% |
| Interquartile 25% (IQ1) | 20.0% | 24.0% |
| Interquartile 75% (IQ3) | 29.9% | 33.5% |
| Interquartile Range (IQR) | 9.9% | 9.5% |
| Standard Deviation (Sample) | 8.2% | 8.8% |
| Standard Deviation (Population) | 8.2% | 8.8% |
Similar Demographics by 3 or more Vehicles in Household
Demographics Similar to Creek by 3 or more Vehicles in Household
In terms of 3 or more vehicles in household, the demographic groups most similar to Creek are British (21.9%, a difference of 0.030%), Alaskan Athabascan (21.9%, a difference of 0.18%), Bangladeshi (21.9%, a difference of 0.19%), Potawatomi (21.9%, a difference of 0.20%), and Portuguese (21.8%, a difference of 0.38%).
| Demographics | Rating | Rank | 3 or more Vehicles in Household |
| Fijians | 99.9 /100 | #62 | Exceptional 22.2% |
| Chickasaw | 99.9 /100 | #63 | Exceptional 22.2% |
| Immigrants | Taiwan | 99.9 /100 | #64 | Exceptional 22.1% |
| Pima | 99.9 /100 | #65 | Exceptional 22.0% |
| Northern Europeans | 99.9 /100 | #66 | Exceptional 22.0% |
| Alaskan Athabascans | 99.9 /100 | #67 | Exceptional 21.9% |
| British | 99.9 /100 | #68 | Exceptional 21.9% |
| Creek | 99.9 /100 | #69 | Exceptional 21.9% |
| Bangladeshis | 99.8 /100 | #70 | Exceptional 21.9% |
| Potawatomi | 99.8 /100 | #71 | Exceptional 21.9% |
| Portuguese | 99.8 /100 | #72 | Exceptional 21.8% |
| Salvadorans | 99.8 /100 | #73 | Exceptional 21.8% |
| Immigrants | Oceania | 99.8 /100 | #74 | Exceptional 21.8% |
| Japanese | 99.8 /100 | #75 | Exceptional 21.8% |
| Immigrants | Nonimmigrants | 99.8 /100 | #76 | Exceptional 21.8% |
Demographics Similar to Immigrants from South Eastern Asia by 3 or more Vehicles in Household
In terms of 3 or more vehicles in household, the demographic groups most similar to Immigrants from South Eastern Asia are Spanish (23.1%, a difference of 0.17%), English (23.1%, a difference of 0.19%), Lumbee (23.1%, a difference of 0.24%), Pueblo (23.0%, a difference of 0.28%), and Spanish American (23.0%, a difference of 0.34%).
| Demographics | Rating | Rank | 3 or more Vehicles in Household |
| Scandinavians | 100.0 /100 | #23 | Exceptional 23.6% |
| Sri Lankans | 100.0 /100 | #24 | Exceptional 23.6% |
| Immigrants | Central America | 100.0 /100 | #25 | Exceptional 23.4% |
| Mexican American Indians | 100.0 /100 | #26 | Exceptional 23.3% |
| Guamanians/Chamorros | 100.0 /100 | #27 | Exceptional 23.2% |
| Lumbee | 100.0 /100 | #28 | Exceptional 23.1% |
| Spanish | 100.0 /100 | #29 | Exceptional 23.1% |
| Immigrants | South Eastern Asia | 100.0 /100 | #30 | Exceptional 23.1% |
| English | 100.0 /100 | #31 | Exceptional 23.1% |
| Pueblo | 100.0 /100 | #32 | Exceptional 23.0% |
| Spanish Americans | 100.0 /100 | #33 | Exceptional 23.0% |
| Swiss | 100.0 /100 | #34 | Exceptional 23.0% |
| Choctaw | 100.0 /100 | #35 | Exceptional 23.0% |
| Cherokee | 100.0 /100 | #36 | Exceptional 23.0% |
| Swedes | 100.0 /100 | #37 | Exceptional 23.0% |